- CryptoQuant’s Bitcoin composite index shows that BTC is in shape for the next rally, signaling a potential price surge.
- Bull flag pattern breakout suggests BTC could hit $171,000 with RSI supporting upside.
Bitcoin Price “Warming Up” for the Next Rally
Bitcoin is continuing a steady upward trend that has defined its recent price action, drawing closer to the $100,000 mark.
This sustained climb suggests that the broader market remains engaged, gradually building momentum. Analysts are now focusing on indicators shaping short-term to mid-term price movements.
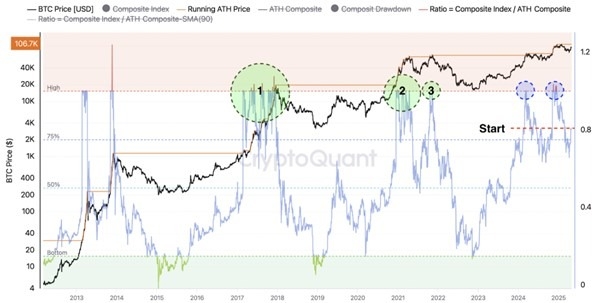
“Bitcoin is warming up,” CryptoQuant contributor Axel Adler Jr. said in a QuickTake post explaining three possible scenarios that could shape BTC’s subsequent rally.
According to Adler Jr., the Bitcoin composite index (BCI) — onchain momentum designed to help investors identify the peaks and bottoms of market cycles — has entered the “start” rally zone, with a momentum ratio of approximately 0.8.
This threshold is considered critical in assessing whether Bitcoin is likely to push higher or enter a period of consolidation.
The analyst underlined three scenarios, with the bullish case outlining a price target above $150,000.
“If the Ratio breaks through 1.0 and holds above it, the NUPL/MVRV metrics will show a new impulse, and the price could reach $150-175K, repeating the cycle logic of 2017 and 2021.”
This scenario mirrors historical breakout phases observed in 2017 and 2021, where a decisive break in key metrics sparked extended bullish runs.

Bitcoin composite index. Source: CryptoQuant
Adler Jr. also presents a baseline scenario where BTC price may consolidate within the $90,000 - $110,000 range, while a bearish case could unfold if further profit-taking from short-term holders takes place, leading to a correction down toward $70,000.
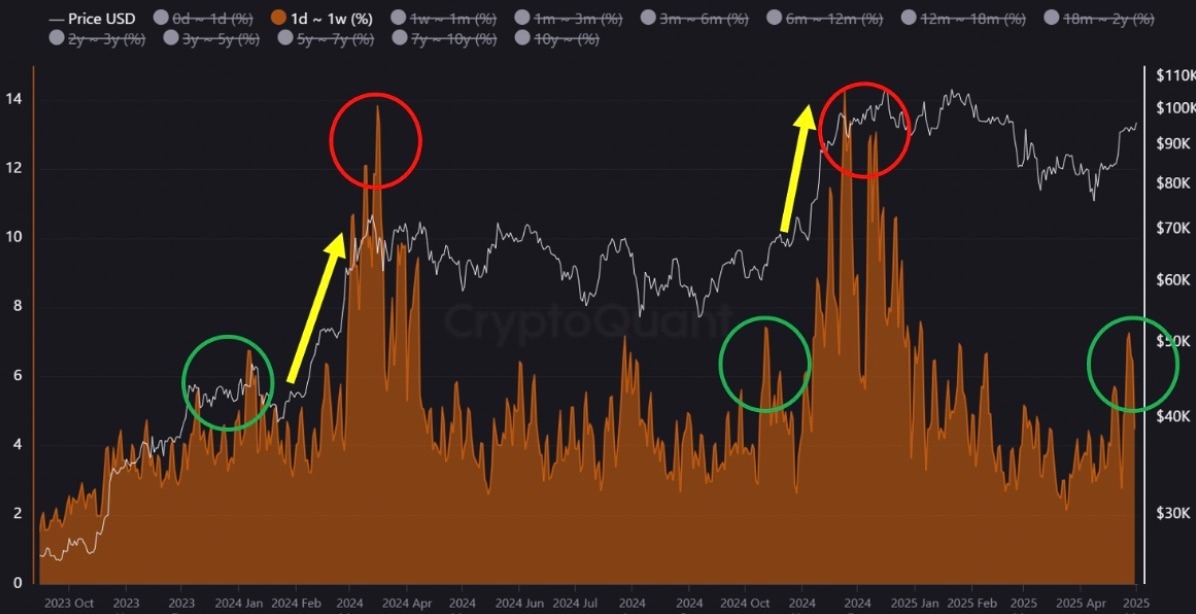
Meanwhile, fellow analyst Crypto Dan said Bitcoin’s current short-term holder (STH)-holder activity mirrors past accumulation phases observed earlier in 2024, which could signal the beginning of another bullish phase, just like in the past.
Notably, this indicator has historically moved ahead of major price surges, making it a reliable accumulation signal.
Crypto Dan added:
“If this trend continues in the short term, Bitcoin may be on track to break above $100K and enter a strong upward phase.”
Bitcoin realized cap - UTXO age bands (%). Source: CryptoQuant
Bitcoin Bull Flag Places Upside Target Above $170,000
From a technical perspective, the Bitcoin price action has validated a bull flag pattern in the weekly timeframe.
A bull flag is a bullish continuation setup that forms after the price consolidates inside a down-sloping range following a sharp price rise.

BTC/USD weekly chart. Source: Cointelegraph/TradingView
The pattern resolved when the price broke above the upper trendline of the flag at $85,400. The price could now rise by as much as the previous uptrend’s height, putting the technical target for Bitcoin price at $171,100 — up 73% from the current price.
Additionally, Bitcoin’s daily relative strength index is positive at 69. This suggests that the market conditions still favored the upside, boosting BTC’s chances of reaching its bull flag target.
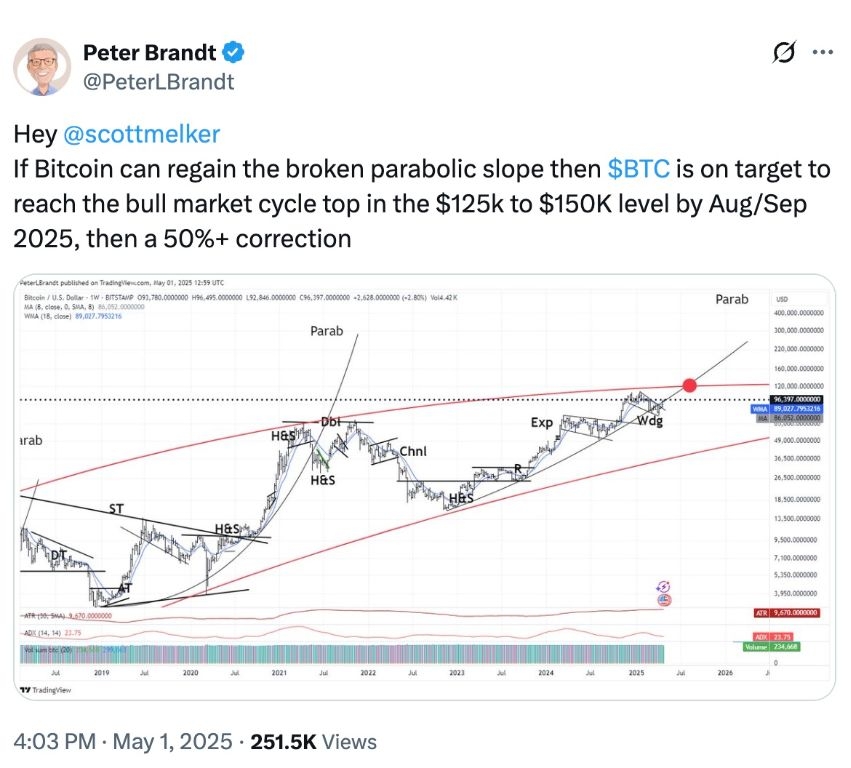
Veteran trader Bitcoin Peter Brandt believes Bitcoin could reach $150,000 by August or September of this year if BTC breaks above the parabolic slope pattern.

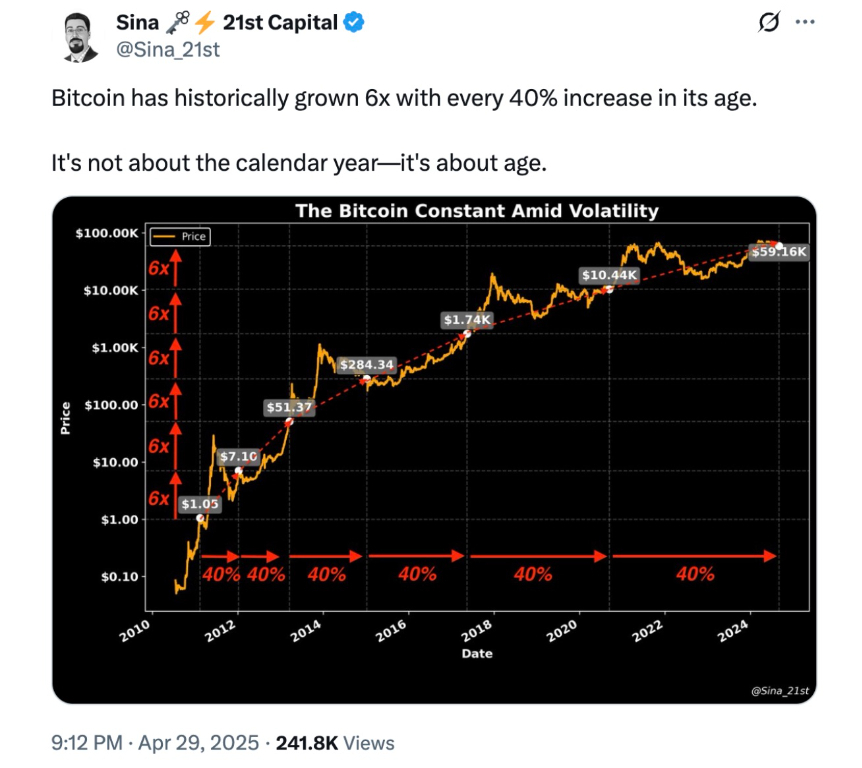
Meanwhile, 21st Capital co-founder Sina projects that BTC price could hit $350,000 by the end of 2025 based on historical patterns on a logarithmic chart.

Source: Sina
