


Amazon (NASDAQ: AMZN) spent two years promising Wall Street that its enormous AI spending would pay off. The latest quarter delivered on that promise and then some, sending the stock to record territory as analysts scramble to lift their price targets. What impact will support levels have following a modest correction?
Unlike most AI megacaps that beat estimates and still sold off, Amazon rallied. What does that divergence say about who is winning the AI infrastructure race?
Top Regulated Brokers
Does the AWS Reacceleration Confirm Amazon’s AI Dominance
AWS surprised bears as it went from lagging its cloud peers to a genuine AI powerhouse. Growth has accelerated for five straight quarters, and management says the bottleneck is no longer demand but capacity, as AI labs and enterprises scramble to lease its chips and computing power. It extends our pre-earnings narrative outlined in our note, “Amazon’s Frontier Model Pivot Ahead of Earnings: Is the Market Underpricing an AWS-Led Beat?”
Another bullish catalyst investors should consider is that Amazon controls more of its stack than its rivals. Custom Trainium chips, Graviton servers, and a deepening Anthropic partnership that feeds inference workloads directly into AWS create a unique competitive edge and support capacity expansion. Did Wall Street misprice this vertical integration?
Key Amazon Fundamental and Valuation Facts to Watch Today
Second-quarter revenue crossed $200 billion for the first time, up 20%, while AWS grew 37% to $42.2 billion, its fastest pace in 18 quarters, with a 39.4% operating margin. The AWS backlog swelled to $496 billion, roughly 2.5 times last year’s level. Strategic AI investments continue with planned 2026 capex of $220 billion, while advertising grew 26% to $19.8 billion. Is Amazon undervalued?
Metric | Value | Verdict |
P/E Ratio | 21.89 | Bullish |
P/B Ratio | 5.44 | Bearish |
PEG Ratio | 1.48 | Bullish |
Current Ratio | 1.03 | Bearish |
Return on Assets | 6.59% | Bearish |
Return on Equity | 30.56% | Bullish |
Profit Margin | 17.44% | Bullish |
ROIC-WACC Ratio | Positive | Bullish |
Dividend Yield | 0.00% | Bearish |
Amazon Fundamental Analysis Snapshot
Price action is testing the upper band of a horizontal support zone and bounced off its descending 0.0% Fibonacci Retracement Fan. The Bull Bear Power Indicator is bearish with an ascending trendline, nearing a bullish crossover. Will bulls receive their next catalysts today?
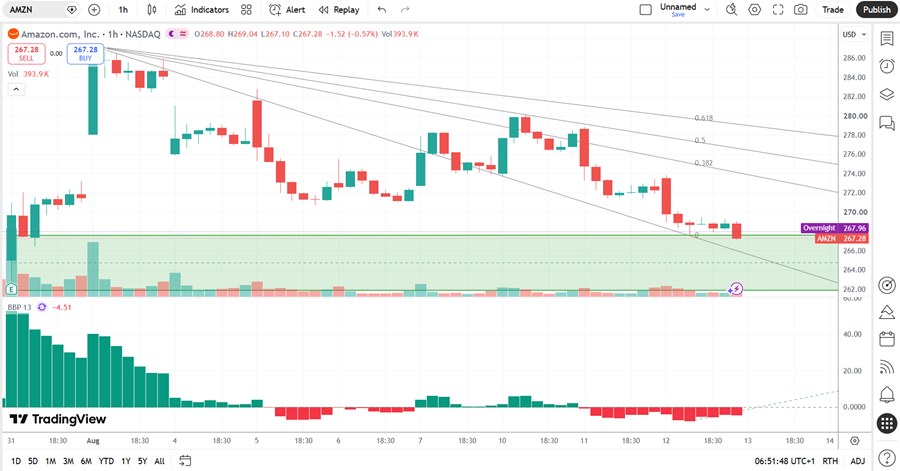
Amazon Price Chart
Where Bears Push Back and Why It May Not Hold
Bears use the same argument as with other AI hyperscalers: massive capex crushes free cash flow and could threaten other business operations. They point to Amazon’s trailing free cash flow going from positive to a $7.6 billion outflow. Bears further argue that headline net income leaned on a $53.4 billion Anthropic paper gain and that AWS growth rates trail Google Cloud and Azure. Are bears rightfully worried?
Bulls counter that revenue growth is outpacing expense growth and that AWS supplied over 60% of operating income. Third-quarter guidance suggests Amazon can unlock more operating leverage. Demand remains capacity-constrained, margins expand through record capex, and cash burn looks like investment. What is the bear case if the spending is paying for itself?
What Today’s Setup Highlights About Market Sentiment
The average analyst price target of $325.19 suggests excellent upside potential, while downside risks are decreasing. Amazon also benefits from upgrades like Benchmark lifting its target to $400, Goldman Sachs to $375, JPMorgan to $365, Truist to $350, and Morgan Stanley to $335. Can Amazon extend its rally after becoming the fifth company to cross a $3 trillion market capitalization?
Options traders confirm bullish sentiment with put-call volume ratios near 0.5. It signals call-heavy positioning, while 30-day implied volatility declined toward the high 20s. Do premiums with a bullish skew suggest more upside?
What’s Next for Amazon’s AI-Driven Story
Could a push through the recent record high unlock the next leg toward consensus targets? Today’s session could confirm bullish sentiment with a bounce higher, but what if bears force a breakdown below $261.78?
My AMZN Long Trade for the Current Setup
AMZN Entry Level: Between $266.33 and $269.44
AMZN Take Profit: Between $299.07 and $308.04
AMZN Stop Loss: Between $252.89 and $258.07
Risk/Reward Ratio: 2.44
Ready to trade our stock market forecast and analysis? Here are the best CFD stocks brokers to choose from.