


Oracle’s Debt Problem: Is Its $638B AI Backlog Hiding a Worsening Cash‑Flow Crunch?
Oracle (NYSE:ORCL) has spent the past year selling investors on a $638 billion AI backlog, but does that headline number obscure a cash flow picture that keeps getting worse beneath the surface for shareholders?
Oracle’s cloud infrastructure growth has been the fastest in its history, but a company can grow its top line while its actual cash generation moves in the opposite direction. Has today’s share price caught up with the underlying balance sheet reality now?
Top Regulated Brokers
Why Oracle’s Cash‑Flow Strain Matters More Than Its AI Backlog
Oracle’s fundamental story is genuinely two-sided. The AI infrastructure buildout is generating enormous contracted revenue commitments, and cloud growth is accelerating quarter after quarter. However, funding that growth requires spending money faster than the business generates, and free cash flow, not revenue or backlog, is what ultimately services debt and funds operations without shareholder dilution. The latter was outlined in last week’s note, “Does Price Reflect Dilution Risk from Pending Equity Issuance?”
Oracle’s recent fiscal year printed $23.7 billion in negative free cash flow, despite operating cash flow rising 54% to $32.0 billion, as capital expenditure jumped to $55.7 billion. Few software companies have ever posted a similar cash burn rate, and it’s increasingly the central question hanging over the stock.
Oracle’s Fundamentals and Price Action: What the Latest Numbers Reveal
Oracle raised roughly $43 billion in debt and $5 billion in equity during the past fiscal year, pushing total debt to more than $130 billion outstanding. Management plans to raise more debt and net capital outlays for the next fiscal year are approximately $70 billion. How much of the current share price contraction reflects the debt servicing risk?
Metric | Value | Verdict |
P/E Ratio | 24.02 | Bullish |
P/B Ratio | 10.76 | Bearish |
PEG Ratio | 0.79 | Bullish |
Current Ratio | 1.12 | Bearish |
Return on Assets | 6.50% | Bearish |
Return on Equity | 53.38% | Bullish |
Profit Margin | 25.37% | Bullish |
ROIC-WACC Ratio | Negative | Bearish |
Dividend Yield | 1.43% | Bearish |
Oracle Fundamental Analysis Snapshot
Price action continues to descend within a bearish price channel but has reached an interesting level to monitor today, trading just above the descending 0.0% Fibonacci Retracement Fan level. The Bull Bear Power Indicator remains bearish, but it shows a positive divergence, adding to today’s cross-current.
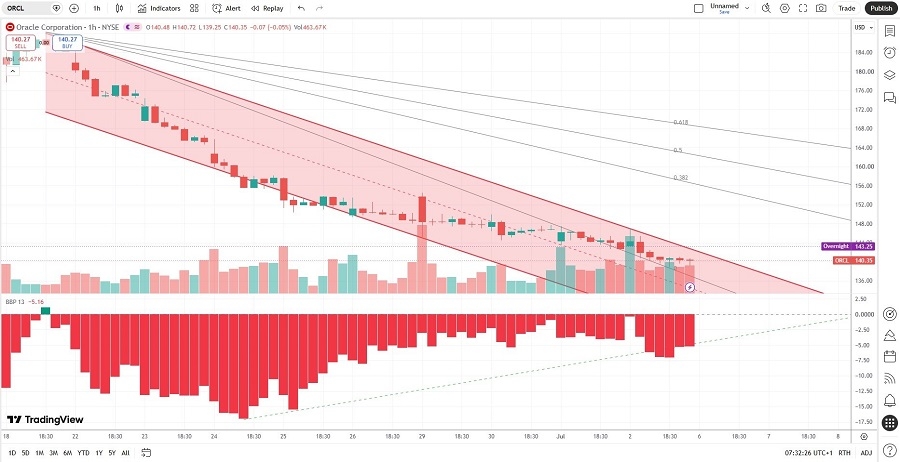
Oracle Price Chart
The Underappreciated Risks in Oracle’s Debt‑Funded AI Expansion
Interest expenses are climbing alongside Oracle’s borrowing, and a persistently higher-for-longer rate environment makes each incremental dollar of debt more expensive to carry over time. Oracle continues to pay a quarterly dividend, but financing capex and shareholder distributions with borrowed money invites scrutiny as negative cash flow persists.
Oracle appears to be preparing for a prolonged period of capital stress rather than a swift return to positive free cash flow. It brought in a new CFO, tasked in part with managing the financing strategy, while lowering operating costs by firing roughly 21,000 employees. Investors are uneasy about spending and debt, but how will rising interest payments to service debt affect price action and future valuation?
How Today’s Market Setup Reflects Sentiment on Oracle’s Balance Sheet
Despite ongoing debt-centered issues affecting Oracle’s balance sheet, the average analyst price target of $251.85 reflects attractive upside potential. That disconnect is worth questioning rather than accepting. Are analysts focused on Oracle’s backlog growth, failing to price in the impacts of continued negative free cash flow?
The combination of heavier debt service and potential additional equity issuance could continue to put pressure on the stock, even if the AI growth narrative stays intact. Does Oracle have a viable path toward positive free cash flow?
Key Levels to Watch as Oracle’s Debt Story Unfolds
Price action trades above its descending 0.0% and 38.2% Fibonacci Retracement Fan levels, and it could challenge the well-established bearish price channel. Still, how will traders react to the increasing number of bullish and bearish factors? The $138.34 level could provide greater downside clarity and extend the correction, but the $147.06 level is worth monitoring, especially if trading volume increases.
Ready to trade our analysis of Oracle? Here is our list of the best stockbrokers worth reviewing.