


Gold stocks are publicly listed companies active in the gold sector. They are primarily involved in the exploration, extraction, and refining of gold. The recent adoption of AI has paved the way for service companies to discover deposits. Gold storage companies offer an alternative to direct exposure to gold. Still, investors should focus on exploration, extraction, and refining of gold via established and junior gold miners.
Top Regulated Brokers
Why should you consider investing in gold stocks?
Gold has always fascinated as a wealth and status symbol, but gold stocks offer numerous benefits, and investors should consider adding them to their portfolios. Gold outperforms during economic uncertainty and geopolitical events, providing downside protection for equity portfolios. Gold stocks also offer an inflation hedge and outperform during periods of US Dollar weakness.
Here are a few things to consider when evaluating gold stocks:
Invest in a combination of established gold miners for stability and dividends, and junior miners, which carry greater risks but offer notable upside potential
Analyze gold reserves of gold miners to gauge the longevity of their operations
Focus 75% of your portfolio on gold stocks with mining operations in the top ten countries for gold production, with the remaining 25% on exciting global projects
What are the downsides of gold stocks?
Volatile gold prices pose the most notable risk, as they directly impact the profitability of gold stocks. While the last three years have seen high gold prices and all-time highs, encouraging exploration and higher dividend yields, other periods have seen depressed prices. Long-term, gold is likely to march higher as the current global economic and political landscape faces graver risks than at any point in the past 70 years.
Here is a shortlist of attractive gold stocks:
Newmont Corporation (NEM)
AngloGold Ashanti (AU)
Contango Ore (CTGO)
Seabridge Gold (SA)
McEwen Mining (MUX)
Newmont Corporation (NYSE:NEM) Fundamental Analysis
Newmont Corporation (NYSE:NEM) is the world’s largest gold mining corporation with operations in the US, Canada, Mexico, the Dominican Republic, Australia, Ghana, Argentina, Peru, and Suriname. It is also a constituent of the S&P 500.
So, why am I bullish on Newmont Corporation at current levels?
The Ahafo North mine in Ghana is achieving full operational capacity, expected to deliver 275,000 to 325,000 of low-cost ounces of gold annually. It will balance lower production from more mature assets. I am also optimistic about its growth pipeline, especially two tier-one assets in Australia, Tanami Expansion 2 (TE2) and Cadia Panel Cave 2-3, which will add high-quality production. Cost-cutting measures and opportunistic M&A add to my bullishness.
Metric | Value | Verdict |
P/E Ratio | 12.47 | Bullish |
P/B Ratio | 2.94 | Bearish |
PEG Ratio | 2.78 | Bearish |
Current Ratio | 2.44 | Bullish |
Return on Assets | 14.89% | Bullish |
Return on Equity | 25.83% | Bullish |
Profit Margin | 33.87% | Bullish |
ROIC-WACC Ratio | Positive | Bullish |
Dividend Yield | 1.04% | Bearish |
Newmont Corporation Fundamental Analysis Snapshot
The price-to-earnings (P/E) ratio of 12.47 makes Newmont Corporation an inexpensive stock. By comparison, the P/E ratio for the S&P 500 Index is 31.45.
The average analyst price target for Newmont Corporation is $140.17. This suggests excellent upside potential with reasonable downside risks.
Newmont Corporation Technical Analysis
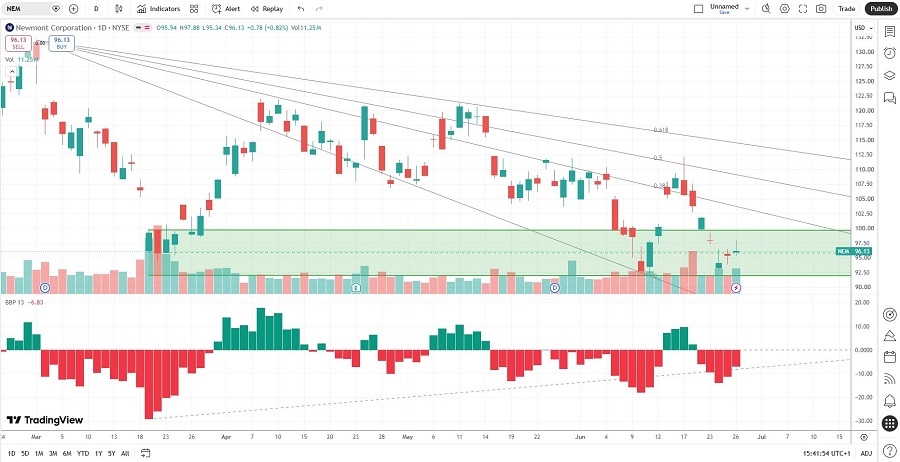
Newmont Corporation Price Chart
The Newmont Corporation D1 chart shows price action between its descending 0.0% and 38.2% Fibonacci Retracement Fan levels.
It also shows Newmont Corporation inside a horizontal support zone.
The Bull Bear Power Indicator is bearish with an ascending trendline, approaching a bullish crossover.
My Newmont Corporation Long Stock Trade
NEM Entry Level: Between $92.02 and $97.88
NEM Take Profit: Between $124.43 and $131.98
NEM Stop Loss: Between $76.05 and $81.34
Risk/Reward Ratio: 2.03
AngloGold Ashanti (NYSE:AU) Fundamental Analysis
AngloGold Ashanti (NYSE:AU) is among the ten largest gold miners globally, operating 21 mines across four continents, with its shares listed on five stock markets.
So, why am I bullish on AngloGold Ashanti despite its recent sell-off?
The full integration and optimization of the Sukari mine in Egypt, a higher-margin, open-pit operation in a stable jurisdiction, and record capital returns form the core of my bullishness. Its operational excellence, particularly in underground mining efficiencies, as evidenced at its Obuasi, Geita, and Cuiabá mines, provides a robust growth catalyst, and I appreciate the diversified revenue stream, including low-cost and high-yield assets.
Metric | Value | Verdict |
P/E Ratio | 11.99 | Bullish |
P/B Ratio | 4.84 | Bearish |
PEG Ratio | 0.74 | Bullish |
Current Ratio | 2.71 | Bullish |
Return on Assets | 22.83% | Bullish |
Return on Equity | 42.97% | Bullish |
Profit Margin | 31.11% | Bullish |
ROIC-WACC Ratio | Positive | Bullish |
Dividend Yield | 5.64% | Bullish |
AngloGold Ashanti Fundamental Analysis Snapshot
The price-to-earnings (P/E) ratio of 11.99 makes AngloGold Ashanti an inexpensive stock. By comparison, the P/E ratio for the S&P 500 Index is 31.45.
The average analyst price target for AngloGold Ashanti is $118.38. This suggests excellent upside potential with decreasing downside risks.
AngloGold Ashanti Technical Analysis
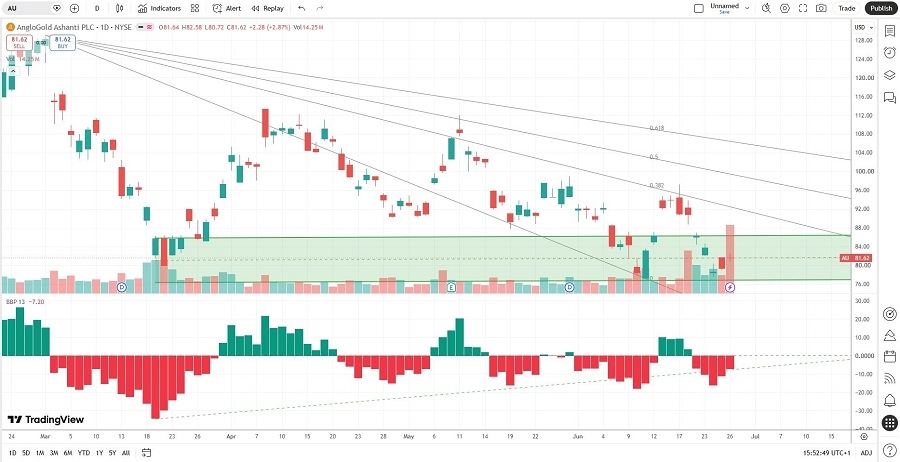
AngloGold Ashanti Price Chart
The AngloGold Ashanti D1 chart shows price action between its descending 0.0% and 38.2% Fibonacci Retracement Fan levels.
It also shows AngloGold Ashanti inside a horizontal support zone.
The Bull Bear Power Indicator is bearish with an ascending trendline, slowly nearing a bullish crossover.
My AngloGold Ashanti Long Stock Trade
AU Entry Level: Between $77.13 and $82.58
AU Take Profit: Between $111.98 and $117.14
AU Stop Loss: Between $62.55 and $67.82
Risk/Reward Ratio: 2.39
Ready to trade our analysis of the best gold stocks to buy? Here is our list of the best brokers for stock trading worth reviewing.