


Data center stocks refer to publicly listed companies that are actively involved in building and operating data centers. These companies are active in construction, power generation, thermal management, and data center operations. There are power-hungry, massive, warehouse-like buildings that house servers and related technology powering AI, the internet, and everything in the cloud.
Why should you consider investing in data center stocks?
Data centers are not a new investment phenomenon, as the internet requires them to operate. The breakthrough in AI adoption in 2022 drove demand, as hyperscalers require massive data centers for AI operations. The data center market is on track to exceed $600 billion by the end of 2030, as part of the multi-trillion AI sector, with annualized double-digit growth rates.
Top Regulated Brokers
Here are a few things to consider when evaluating data center stocks:
Research data center stocks with revenue growth over the past three years.
Diversify your data center portfolio with companies that construct data centers, provide thermal management, and server components.
Mix your data center stock portfolio with companies involved in electricity generation.
Analyze the balance sheet and avoid high-debt data center stocks.
Check the Power Utilization Effectiveness (PUE), a core indicator of how efficiently the data center operates, together with occupancy rates.
What are the downsides of data center stocks?
The data center segment is highly competitive and requires massive capital expenditures to ensure servers run with the most cutting-edge technology. Energy availability is another significant factor, with some hyperscalers preferring co-location rather than relying on the energy provider. The AI hype has spiked valuations, which is adding to downside risks. The AI boom will eventually slow down, technological breakthroughs could result in lower data center demand than currently planned, and rising electricity costs could threaten capital expenditure plans.
Here is a shortlist of data center stocks to consider:
Fabrinet (FN)
Applied Digital (APLD)
WhiteFiber (WYFI)
Modine Manufacturing (MOD)
Core Scientific (CORZ)
Fabrinet (NYSE:FN) Fundamental Analysis
Fabrinet (NYSE:FN) manufactures advanced optical packaging and precision optical, electro-mechanical, and electronic manufacturing services. Fabrinet is also a member of the Russell 2000.
So, why am I bullish on Fabrinet following its 30%+ correction?
While the broad-based sell-off has dropped Fabrinet, it remains a contract-manufacturing specialist for AI optics and photonics, which are core technologies in the expanding AI ecosystem. FN is a pure-play stock that can partner with major industry players without conflict, and I am bullish on demand for its next-generation optical transceivers, integrated silicon photonics, and co-packaged optics architecture. They address data center interconnect speeds, the next hurdle in advancing AI.
Metric | Value | Verdict |
P/E Ratio | 45.05 | Bearish |
P/B Ratio | 8.16 | Bearish |
PEG Ratio | 1.73 | Bullish |
Current Ratio | 2.55 | Bullish |
Return on Assets | 8.52% | Bearish |
Return on Equity | 19.99% | Bullish |
Profit Margin | 9.94% | Bullish |
ROIC-WACC Ratio | Positive | Bullish |
Dividend Yield | 0.00% | Bearish |
Fabrinet Fundamental Analysis Snapshot
The price-to-earnings (P/E) ratio of 45.05 makes Fabrinet an expensive stock. By comparison, the P/E ratio for the NASDAQ 100 Index is 35.33.
The average analyst price target for Fabrinet is $749.11. This suggests excellent upside potential with manageable downside risks.
Fabrinet Technical Analysis
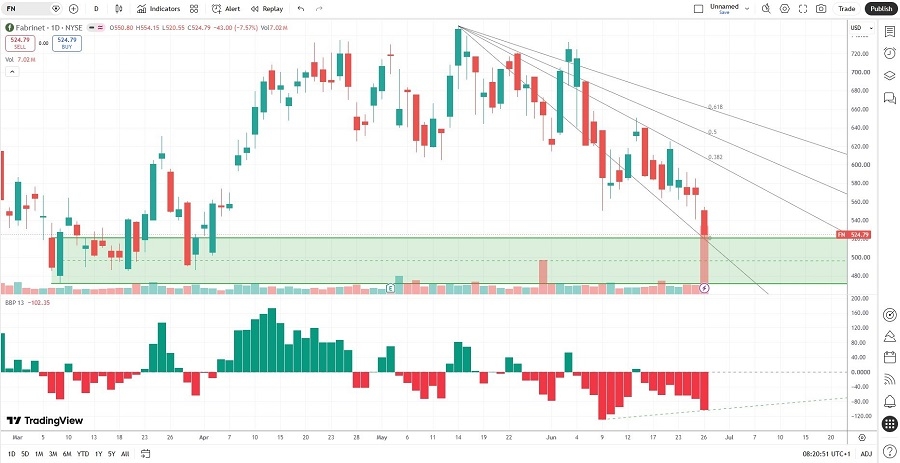
Fabrinet Price Chart
The Fabrinet D1 chart shows price action between its descending 0.0% and 38.2% Fibonacci Retracement Fan levels.
It also shows Fabrinet approaching a crucial horizontal support zone.
The Bull Bear Power Indicator is bearish with a positive divergence.
My Fabrinet Long Stock Trade
FN Entry Level: Between $502.01 and $531.89
FN Take Profit: Between $690.40 and $708.09
FN Stop Loss: Between $412.08 and $424.44
Risk/Reward Ratio: 2.10
Applied Digital (NASDAQ:APLD) Fundamental Analysis
Applied Digital (APLD) designs, develops, and operates digital infrastructure solutions. It focuses on high-performance computing (HPC) and artificial intelligence industries via its two business segments: Data Center Hosting Business and HPC Hosting Business. It also offers infrastructure services to crypto miners.
So, why am I bullish on Applied Digital at current levels?
The Polaris Forge 1 campus became fully operational this month, transitioning the company from the development phase to cash-flow positive. CoreWeave leased the entire site under a 15-year, $11 billion contract, creating stable, recurring revenue for Applied Digital, and forming the core of my bullishness. I am equally bullish on a long-term lease agreement at Delta Forge 2 and construction plans for Building 2 at Polaris Forge.
Metric | Value | Verdict |
P/E Ratio | Unavailable | Bearish |
P/B Ratio | 7.08 | Bearish |
PEG Ratio | Unavailable | Bearish |
Current Ratio | 2.38 | Bullish |
Return on Assets | -0.60% | Bearish |
Return on Equity | -5.56% | Bearish |
Profit Margin | -59.47% | Bearish |
ROIC-WACC Ratio | Negative | Bearish |
Dividend Yield | 0.0% | Bearish |
Applied Digital Fundamental Analysis Snapshot
The price-to-earnings (P/E) ratio for Applied Digital is unavailable. By comparison, the P/E ratio for the NASDAQ 100 Index is 35.33.
The average analyst price target for Applied Digital is $73.36. This suggests that there is excellent upside potential and fading downside risk.
Applied Digital Technical Analysis
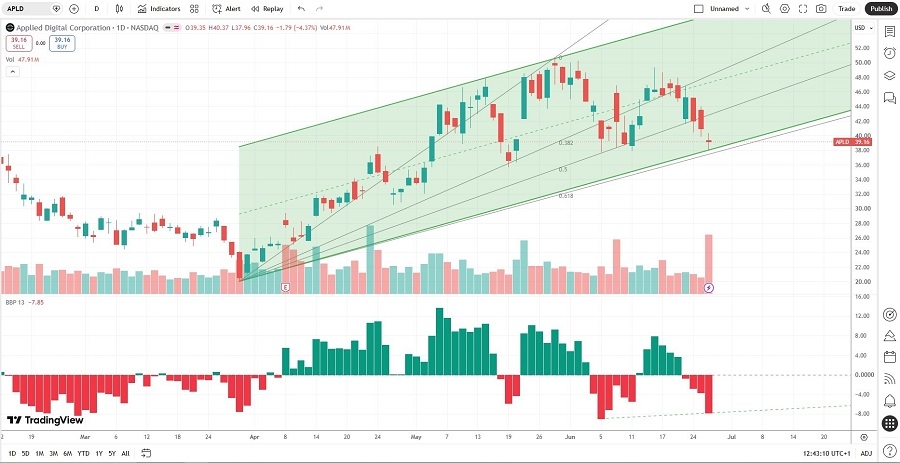
Applied Digital Price Chart
The Applied Digital D1 chart shows price action between its ascending 50.0% and 61.8% Fibonacci Retracement Fan levels.
It also shows Applied Digital inside a bullish price channel.
The Bull Bear Power Indicator is bearish with a positive divergence.
My Applied Digital Long Stock Trade
APLD Entry Level: Between $37.96 and $40.37
APLD Take Profit: Between $66.27 and $69.58
APLD Stop Loss: Between $27.35 and $30.51
Risk/Reward Ratio: 2.67
Ready to trade our analysis of the best data center stocks to buy? Here is our list of the best brokers for stock trading worth reviewing.