
Do Engineering Setbacks Point to Mispriced Risk?
Top Regulated Brokers
Apple (NASDAQ:AAPL) continues to navigate challenging circumstances. While bulls may have zeroed in on valuation, how will recent engineering setbacks and product delays affect price action and investor sentiment going forward? Will it magnify the impact of the unusual management decision on mid-cycle price increases, or will consumer loyalty ultimately prevail over short-term concerns?
While some retail investors may view yesterday’s upward drift as a bullish sentiment confirmation, how will it play out within a broader, potentially more ominous bearish chart formation?
Why Apple’s Engineering Setbacks Matter for Shareholders
Cutting-edge technology remains the sole differentiator in an ultra-competitive and saturated smartphone market. Apple is already behind the AI curve and has failed to inspire Apple enthusiasts, as noted in last week’s note, “Did the Disappointing Apple WWDC Reception Point to More Downside?” Apple used to pride itself on engineering excellence, but has taken on the role of follower, while allowing Asian competitors to lead in breakthrough technologies.
Apple has now further delayed the iPhone Fold to 2027 following technical failures during early testing. This engineering setback removes a growth catalyst and allows competitors to manifest their market position in this high-end segment. While bulls can absorb one bearish development, how will the accumulation of recent events impact sentiment overall?
Key Apple Valuation and Fundamental Facts to Watch Today
Apple has removed a core growth catalyst for the next year and could run thin on arguments to justify its current valuations. Does the engineering setback compound the issues from its rare mid-cycle price hikes across its Mac, iPad, and Vision Pro lines, where it hiked prices between $100 to $300 per model to offset surging input costs?
Metric | Value | Verdict |
P/E Ratio | 34.15 | Bearish |
P/B Ratio | 38.86 | Bearish |
PEG Ratio | 2.28 | Bearish |
Current Ratio | 1.07 | Bearish |
Return on Assets | 26.23% | Bullish |
Return on Equity | 141.47% | Bullish |
Profit Margin | 27.15% | Bullish |
ROIC-WACC Ratio | Positive | Bullish |
Dividend Yield | 0.37% | Bearish |
Apple Fundamental Analysis Snapshot
Apple trades within a bearish price channel, but has drifted moderately higher between the upper and lower bands. The Bull Bear Power Indicator turned bullish, but a descending trendline is pushing it closer towards a bearish crossover, which could provide the catalysts to extend the ongoing correction.
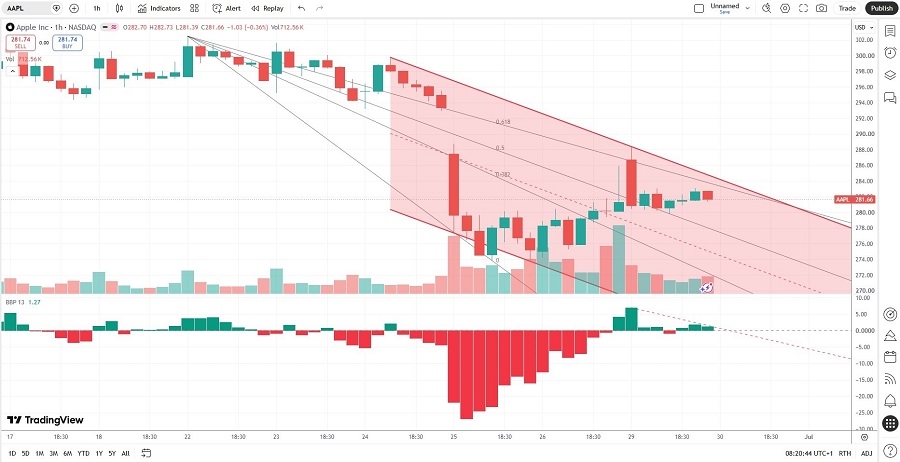
Apple Price Chart
The Underappreciated Risks Behind Apple’s Premium Valuation
Apple continues to take away reason to buy or upgrade their devices. While the recent engineering setback focuses on a niche, high-end segment of the smartphone market, the more compelling argument is that it calls into question the engineering excellence Apple built under the late founder and CEO Steve Jobs. Apple’s wait-and-see approach may work reasonably well inside the US market, but the recent setbacks, including the price increases, have raised the specter of falling demand.
It already trails in AI and now asks consumers to pay more for less. How will this impact fundamentals, especially with the deceleration in services revenue from its App Store? With shares approaching the next test near $281.00, how will current sentiment react?
What Today’s Apple Setup Reveals About Market Sentiment
Despite its ongoing correction, the average analyst price target of $315.09 suggests reasonable upside potential for patient investors ahead. Engineering breakthroughs usually follow setbacks, and how investors react to the dilemma of market share losses in a hard-to-penetrate market, while asking higher prices for devices that offer less of a wow-factor, could determine how much further the current correction will last and when a tangible reversal materializes. Still, how steep a price is Apple paying for its wait-and-see approach here today?
What’s Next for Apple’s Price Action?
Short-term bullish sentiment within a bearish trend is normal price action behavior and often confirms the health of the broader trend. With shares near the descending 61.8% Fibonacci Retracement Fan level, it will be interesting to see how current sentiment handles this level, and the $279.41 level may provide the next directional clue. Can today’s session extend the broader trend?
Ready to trade our analysis of Apple? Here is our list of the best stockbrokers worth reviewing.