
Short Trade Idea
Enter your short position between $325.40 (yesterday’s intra-day low) and $329.28 (yesterday’s intra-day high).
Market Index Analysis
Visa (NYSE:V) is a member of the Dow Jones Industrial Average Index, the S&P 100 Index, and the S&P 500 Index.
All three indices remain near records despite mounting bearish developments.
The Bull Bear Power Indicator for the S&P 500 Index is bullish with a negative divergence.
Market Sentiment Analysis
Equity futures are drifting moderately higher following yesterday’s sell-off as tensions between the US and Iran flared as fire was exchanged in the Strait of Hormuz, while the UAE and Iran confirmed that Iran launched an attack against the former OPEC member. Oil prices remain above $100 per barrel, but markets are dismissing the long-term negative impact of higher input costs. On the earnings front, Shopify, Pfizer, and Advanced Micro Devices highlight today’s releases.
Visa Fundamental Analysis
Visa is one of the world’s top three payment card service providers and the largest outside China. It facilitates electronic funds transfers globally.
So, why am I bearish on V following its post-earnings breakdown?
Visa beat revenue and earnings per share expectations of $10.75 billion and $3.10, reporting $11.23 billion and $3.31, respectively. Still, I became bearish amid the Credit Card Competition Act (CCCA), which threatens Visa’s interchange fee model. I am equally bearish on consumer spending risks amid ballooning credit card debt and a soon-to-hit inflationary hit on food from the US-Iran war. Visa also faces rising competition from PayPal, Stripe, and embedded finance and stablecoin-based payment systems, which threaten margins.
Metric | Value | Verdict |
P/E Ratio | 28.57 | Bearish |
P/B Ratio | 17.76 | Bearish |
PEG Ratio | 1.72 | Bearish |
Current Ratio | 1.09 | Bearish |
ROIC-WACC Ratio | Positive | Bullish |
Visa Fundamental Analysis Snapshot
The price-to-earnings (P/E) ratio of 28.57 indicates that V is fairly valued. By comparison, the P/E ratio for the S&P 500 Index is 30.96.
The average analyst price target for V is $397.46. This suggests that there is some excellent upside potential, but downside risks are greater.
Visa Technical Analysis
Today’s V Signal
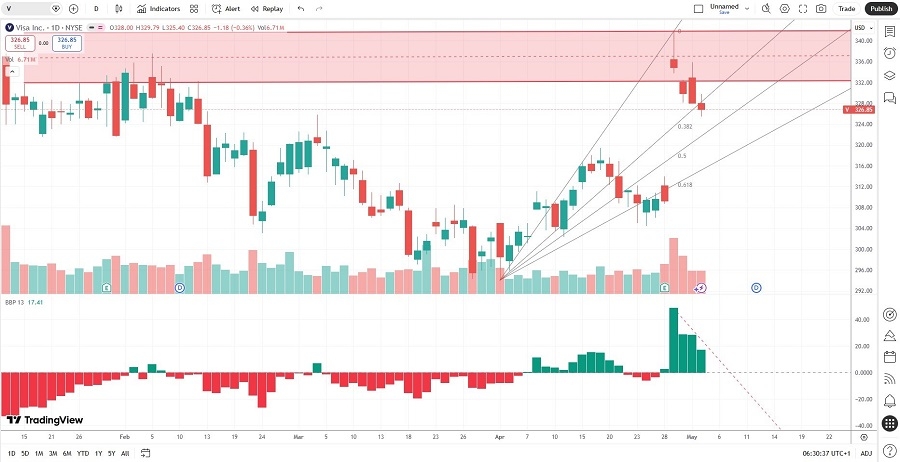
Visa Price Chart
The V D1 chart shows price action breaking down below its horizontal resistance zone.
It also shows price action between its ascending 38.2% and 50.0% Fibonacci Retracement Fan levels.
The Bull Bear Power Indicator is bullish with a descending trendline.
The average bearish trading volumes are higher than the average bullish trading volumes.
V corrected more than the S&P 500 Index, a bearish confirmation.
My V Short Stock Trade
V Entry Level: Between $325.40 and $329.28
V Take Profit: Between $291.58 and $296.346
V Stop Loss: Between $341.98 and $348.82
Risk/Reward Ratio: 2.04
Ready to trade our analysis of Visa? Here is our list of the best stockbrokers worth reviewing.