
Short Trade Idea
Enter your short position between $105.60 (yesterday’s intra-day low) and $108.79 (an intermediate horizontal resistance level).
Market Index Analysis
Shopify (NASDAQ:SHOP) is a member of the NASDAQ 100 Index.
This index records all-time highs amid a backdrop of rising bearish factors.
The Bull Bear Power Indicator for the NASDAQ 100 Index is bullish with a negative divergence.
Market Sentiment Analysis
Equity futures are advancing following another tech-fueled rally, getting another boost as President Trump suspends the American operation to reopen the Strait of Hormuz. AMD and SMCI surged by double-digit percentages in after-hours trading after reporting earnings. Today’s ADP data will offer a snapshot of the labor market before Friday’s NFP report. Novo Nordisk, The Walt Disney Company, and Uber highlight today’s earnings.
Shopify Fundamental Analysis
Shopify is a leading e-commerce platform with nearly 60% of its business in the US. It is known as the go-to e-commerce platform for startups due to its fair fee structure and user-friendly platform.
So, why am I bearish on SHOP following its post-earnings sell-off?
Shopify reported revenues of $3.10 billion, ahead of expectations of $3.05 billion, while earnings per share of $0.29 missed expectations of $0.33. SHOP also delivered a disappointing full-year outlook. I remain bearish amid excessive valuations and decelerating growth. Rising loan and transaction losses pose a significant headwind, magnified by worsening consumer sentiment and rising borrowing costs. Operational complexity stemming from integration issues with third-party services limits scalability, especially for smaller companies, as customer acquisition costs are rising.
Metric | Value | Verdict |
P/E Ratio | 105.52 | Bearish |
P/B Ratio | 12.29 | Bearish |
PEG Ratio | 2.41 | Bearish |
Current Ratio | 5.96 | Bullish |
ROIC-WACC Ratio | Negative | Bearish |
Shopify Fundamental Analysis Snapshot
The price-to-earning (P/E) ratio of 105.52 makes SHOP an expensive stock. By comparison, the P/E ratio for the NASDAQ 100 Index is 36.62.
The average analyst target for SHOP is $159.49. This suggests excellent upside potential, with elevated downside risk.
Shopify Technical Analysis
Today’s SHOP Signal
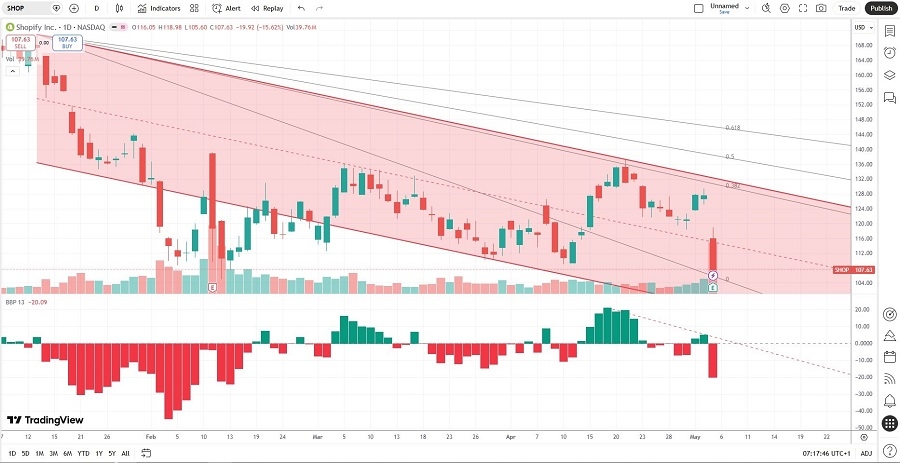
Shopify Price Chart
The SHOP D1 chart shows price action inside a bearish price channel.
It also shows price action between its descending 0.0% and 38.2% Fibonacci Retracement Fan levels.
The Bull Bear Power Indicator is bearish and below its descending trendline.
The average bearish trading volumes are higher than the average bullish trading volumes.
SHOP corrected as the NASDAQ 100 Index recorded a new all-time high, a major bearish confirmation.
My SHOP Short Stock Trade
SHOP Entry Level: Between $105.60 and $108.79
SHOP Take Profit: Between $69.84 and $74.67
SHOP Stop Loss: Between $118.98 and $125.10
Risk/Reward Ratio: 2.67
Ready to trade our analysis of Shopify? Here is our list of the best stockbrokers worth reviewing.