
Short Trade Idea
Enter your short position between $112.35 (yesterday’s intra-day low) and $115.32 (an intermediate horizontal resistance level).
Market Index Analysis
Entergy Corporation (NYSE:ETR) is a member of the S&P 500 Index.
This index records all-time highs despite worsening macroeconomic issues.
The Bull Bear Power Indicator for the S&P 500 Index is bullish with a negative divergence.
Market Sentiment Analysis
Equity futures are moving higher and extending their record run amid optimism over tech earnings, but ARM Holdings sent jitters through markets amid chip supply concerns, while monitoring progress in the US-Iran peace process and ignoring macroeconomic issues from higher-for-longer oil prices, troubling consumer credit developments with auto loans the latest flashpoint, and market stability risks from private credit. Earnings from McDonald’s, Shake Shack, and Papa John’s will offer more consumer spending insights today.
Entergy Corporation Fundamental Analysis
Entergy Corporation is a utility company that provides electric power with 24,000 megawatts of generating capacity. It serves over 3,000,000 customers in Arkansas, Louisiana, Mississippi, and Texas.
So, why am I bearish on ETR despite strong earnings?
Entergy Corporation reported revenues of $3.19 billion and earnings per share of $0.86, beating expectations of $2.89 billion and $0.84, respectively. I remain bearish amid high valuations for a utility company and accelerating insider selling with no purchases over the past three months. ETR also faces rising execution risks in its core market and relies heavily on leverage and is issuing more shares to finance its ambitious four-year capex of $57 billion. Regulatory risk adds another bearish medium-term risk.
Metric | Value | Verdict |
P/E Ratio | 28.82 | Bearish |
P/B Ratio | 3.10 | Bearish |
PEG Ratio | 2.32 | Bearish |
Current Ratio | 0.96 | Bearish |
ROIC-WACC Ratio | Negative | Bearish |
Entergy Corporation Fundamental Analysis Snapshot
The price-to-earnings (P/E) ratio of 28.82 makes ETR an expensive stock, especially for a utility company, which has an average P/E ratio over 30% lower. By comparison, the P/E ratio for the S&P 500 Index is 31.66.
The average analyst price target for ETR is $121.64. This suggests moderate upside potential, but downside risks are higher.
Entergy Corporation Technical Analysis
Today’s ETR Signal
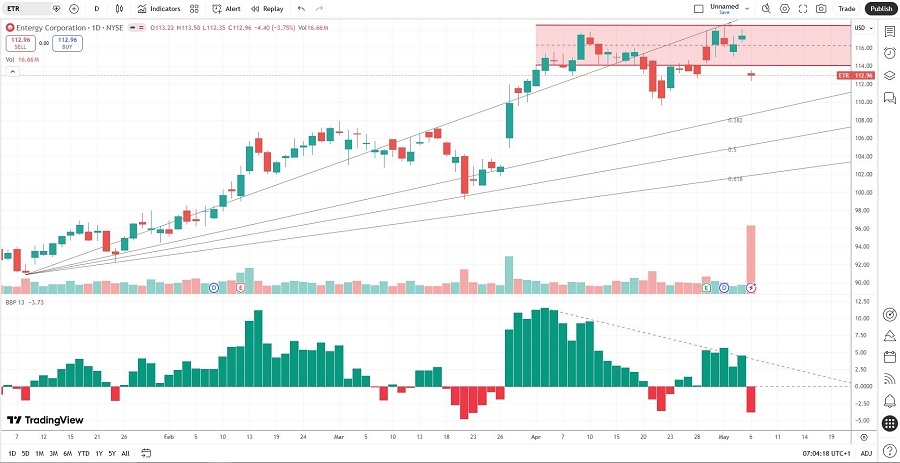
Entergy Corporation Price Chart
The ETR D1 chart shows price action breaking down below its horizontal resistance zone.
It also shows price action between its ascending 0.0% and 38.2% Fibonacci Retracement Fan levels.
The Bull Bear Power Indicator turned bearish and is below its descending trendline.
The average bearish trading volumes are higher than the average bullish trading volumes.
ETR sold off as the S&P 500 Index reached a new all-time high, a significantly bearish confirmation.
My ETR Short Stock Trade
ETR Entry Level: Between $112.35 and $115.32
ETR Take Profit: Between $90.92 and $94.45
ETR Stop Loss: Between $121.64 and $125.29
Risk/Reward Ratio: 2.31
Ready to trade our analysis of the Entergy Corporation? Here is our list of the best stockbrokers worth checking out.