
Top Regulated Brokers
Long Trade Idea
Enter your long position between $59.65 (yesterday’s intra-day low) and $61.46 (yesterday’s intra-day high).
Market Index Analysis
DexCom (NASDAQ:DXCM) is a member of the NASDAQ 100 Index and the S&P 500 Index.
Both indices retreated from all-time highs amid rising inflation and decreasing wages but remain excessively high and disconnected from economic reality.
The Bull Bear Power Indicator for the S&P 500 Index is bullish with a negative divergence.
Market Sentiment Analysis
Equity futures are moderately recovering following yesterday’s mostly bearish sessions after April’s CPI report came in higher than expected at 3.8% annually, while real average hourly wages decreased 0.5% monthly and 0.3% annually. US President Trump will travel to China to meet President Xi, while Kevin Warsh received his Senate approval, and Cisco Systems and Alibaba Group earnings are likely to overshadow April’s PPI report.
DexCom Fundamental Analysis
DexCom is a leader in continuous glucose monitoring (CGM). Its G7 device is the most accurate CGM approved in the US, and DexCom is at the core of the MAHA (Make America Healthy Again) movement.
So, why am I bullish on DXCM at current levels?
DexCom beat revenue and earnings per share expectations of $1.17 billion and $0.47, reporting $1.19 billion and $0.56, respectively. I remain bullish on DXCM, driven by the pending Medicare CGM coverage expansion in type 2 diabetes patients not on insulin, which could add millions of new patients. I am equally bullish on its expansion into the wellness and metabolic health markets through the Stelo OTC sensor and strategic partnership with the Oura Ring.
Metric | Value | Verdict |
P/E Ratio | 26.24 | Bullish |
P/B Ratio | 7.91 | Bearish |
PEG Ratio | 1.13 | Bullish |
Current Ratio | 1.95 | Bullish |
ROIC-WACC Ratio | Positive | Bullish |
DexCom Fundamental Analysis Snapshot
The price-to-earning (P/E) ratio of 26.24 makes DXCM an inexpensive stock. By comparison, the P/E ratio for the S&P 500 Index is 31.86.
The average analyst price target for DXCM is $83.54. This suggests excellent upside potential with decreasing downside risks.
DexCom Technical Analysis
Today’s DXCM Signal
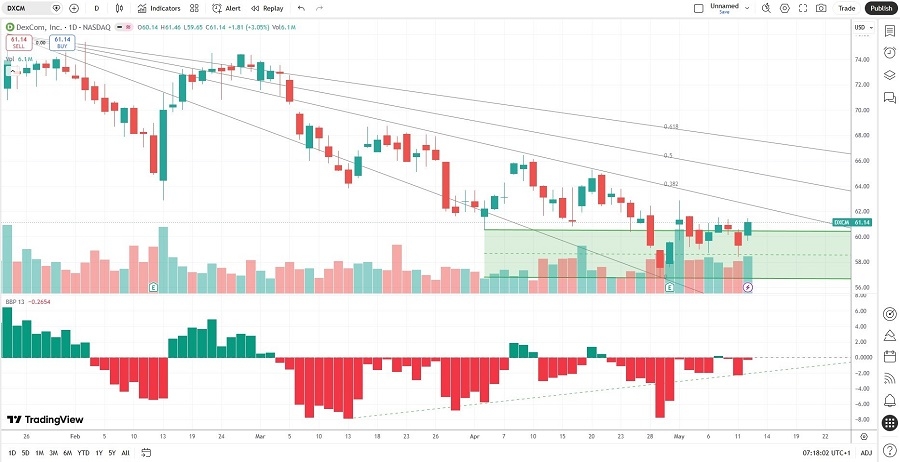
DexCom Price Chart
The DXCM D1 chart shows price action breaking out above a horizontal support zone.
It also shows price action between its descending 0.0% and 38.2% Fibonacci Retracement Fan levels.
The Bull Bear Power Indicator is bearish with an ascending trendline, nearing a bullish crossover.
The average bullish trading volumes are higher than the average bearish trading volumes.
DXCM corrected as the S&P 500 Index recorded new all-time highs, a bearish signal, but bullish catalysts are rising.
My DXCM Long Stock Trade
DXCM Entry Level: Between $59.65 and $61.46
DXCM Take Profit: Between $83.54 and $86.05
DXCM Stop Loss: Between $48.50 and $51.05
Risk/Reward Ratio: 2.14
Ready to trade our analysis of DexCom? Here is our list of the best stockbrokers worth reviewing.