
Short Trade Idea
Enter your short position between $268.80 (yesterday’s intra-day low) and $276.10 (yesterday’s intra-day high).
Market Index Analysis
Amazon.com (NASDAQ:AMZN) is a member of the NASDAQ 100 Index, the Dow Jones Industrial Average Index, the S&P 100 Index, and the S&P 500 Index.
All four indices remain near records despite mounting bearish developments.
The Bull Bear Power Indicator for the NASDAQ 100 Index is bullish with a negative divergence.
Market Sentiment Analysis
Equity futures are drifting moderately higher following yesterday’s sell-off as tensions between the US and Iran flared as fire was exchanged in the Strait of Hormuz, while the UAE and Iran confirmed that Iran launched an attack against the former OPEC member. Oil prices remain above $100 per barrel, but markets are dismissing the long-term negative impact of higher input costs. On the earnings front, Shopify, Pfizer, and Advanced Micro Devices highlight today’s releases.
Amazon.com Fundamental Analysis
Amazon.com is one of the Big Five US technology companies and a leader in the global AI race and cloud computing sector. It has excellent profit margins, but its debt remains excessive. AMZN is an industry disruptor but faces stiff competition from China.
So, why am I bearish on AMZN despite its earnings beat?
Amazon.com reported revenues of $181.52 billion with earnings per share of $2.78, beating estimates of $177.28 billion and $1.63, respectively. Despite the beat, I turned bearish due to the record $200 billion 2026 capex plan aimed at AI and its Leo satellite constellation. Valuations are stretched, while its core revenue generator, AWS, is facing slowing growth rates and market share loss amid rising competition. E-commerce is grappling with competition and consumer spending issues, further applying downside margin pressures.
Metric | Value | Verdict |
P/E Ratio | 32.04 | Bearish |
P/B Ratio | 6.53 | Bearish |
PEG Ratio | 1.89 | Bearish |
Current Ratio | 1.18 | Bearish |
ROIC-WACC Ratio | Positive | Bullish |
Amazon.com Fundamental Analysis Snapshot
The price-to-earnings (P/E) ratio of 32.04 indicates that AMZN is fairly valued. By comparison, the P/E ratio for the NASDAQ 100 Index is 36.16.
The average analyst price target for AMZN is $307.60. This suggests moderate upside potential with rising downside risks.
Amazon.com Technical Analysis
Today’s AMZN Signal
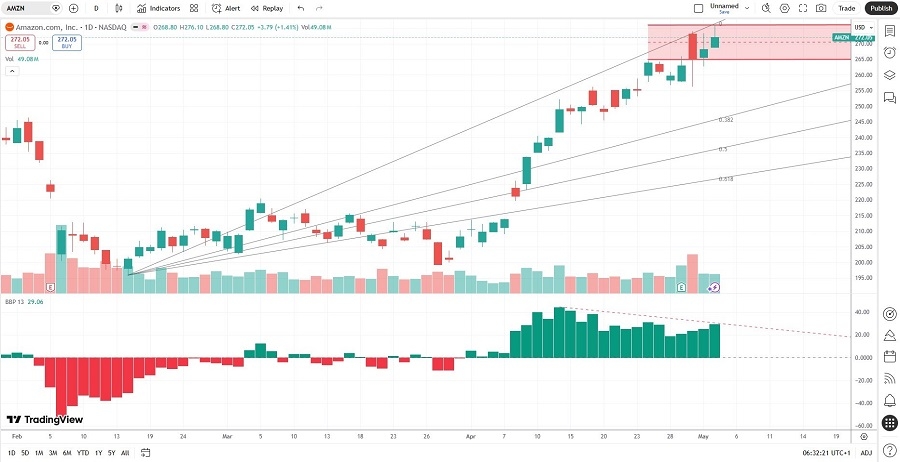
Amazon.com Price Chart
The AMZN D1 chart shows price action forming a new horizontal resistance zone.
It also shows price action between its ascending 0.0% and 38.2% Fibonacci Retracement Fan levels.
The Bull Bear Power Indicator is bullish with a negative divergence.
The average bearish trading volumes are higher than the average bullish trading volumes.
AMZN advanced while the NASDAQ 100 Index corrected, a bullish confirmation, but bearish catalysts are rising.
My AMZN Short Stock Trade
AMZN Entry Level: Between $268.80 and $276.10
AMZN Take Profit: Between $219.62 and $231.82
AMZN Stop Loss: Between $291.85 and $300.61
Risk/Reward Ratio: 2.13
Ready to trade our analysis of Amazon? Here is our list of the best stockbrokers worth reviewing.