
Short Trade Idea
Enter your short position between $308.70 (an intermediate horizontal support level) and $312.54 (Friday’s intra-day high).
Market Index Analysis
McDonald’s (NYSE:MCD) is a member of the Dow Jones Industrial Average Index, the S&P 100 Index, and the S&P 500 Index.
All three indices recorded fresh all-time highs, but bullish trading volumes remain below average, hinting at potential issues ahead.
The Bull Bear Power Indicator for the NASDAQ 100 Index surged into extremely bullish territory, suggesting excessive bullishness vulnerable to a reversal.
Market Sentiment Analysis
Equity futures are retreating this morning after the US-Iran tensions re-escalated following the capture of an Iranian vessel by the US. The Strait of Hormuz is closed again. President Trump renewed his threats to target Iranian energy facilities and civil infrastructure unless Iran listens to US demands. Oil is nearing $90 per barrel, while gold resumes its sell-off. Earnings from Tesla, Intel, and United Airlines highlight this week’s earnings calendar.
McDonald’s Fundamental Analysis
McDonald’s is a fast-food chain with the second-largest number of locations globally. It is also a significant real estate owner and investor, and the second-largest private employer with over 1.7 million employees.
So, why am I bearish on MCD despite its recent breakout?
McDonald’s faces stiff competition and rising beef prices, while valuations are high, leaving little room for surprises in its next earnings release. I am bearish on its negative equity, operational risks to defend its market positions, and recent reputational risks stemming from social media scrutiny ahead of new menu launches. I am equally bearish on margin pressure related to surging commodity prices.
Metric | Value | Verdict |
P/E Ratio | 26.03 | Bearish |
P/B Ratio | Negative | Bearish |
PEG Ratio | 2.79 | Bearish |
Current Ratio | 0.95 | Bearish |
ROIC-WACC Ratio | Positive | Bullish |
McDonald’s Fundamental Analysis Snapshot
The price-to-earning (P/E) ratio of 26.03 makes MCD an expensive stock. By comparison, the P/E ratio for the S&P 500 Index is 25.66.
The average analyst price target for MCD is $344.67. This suggests moderate upside potential with rising downside risk.
McDonald’s Technical Analysis
Today’s MCD Signal
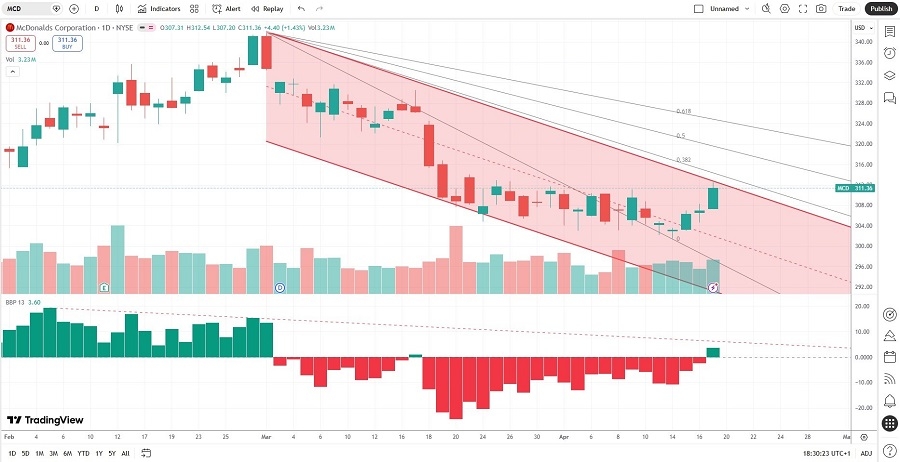
McDonald’s Price Chart
The MCD D1 chart shows price action inside a bearish price channel.
It also shows price action between its descending 0.0% and 38.2% Fibonacci Retracement Fan levels.
The Bull Bear Power Indicator turned bullish but remains below its descending trendline.
The average bearish trading volumes are higher than the average bullish trading volumes.
MCD advanced less than the S&P 500 Index, a bearish confirmation.
My MCD Short Stock Trade
MCD Entry Level: Between $308.70 and $312.54
MCD Take Profit: Between $276.53 and $281.72
MCD Stop Loss: Between $324.50 and $330.49
Risk/Reward Ratio: 2.04
Ready to trade our analysis of McDonald’s? Here is our list of the best stock brokers worth reviewing.