
Short Trade Idea
Enter your short position between $45.27 (yesterday’s intra-day low) and $46.95 (an intermediate horizontal resistance level).
Market Index Analysis
Fastenal (NASDAQ:FAST) is a member of the NASDAQ 100 Index and the S&P 500 Index.
Both indices have rallied on low bullish trading volumes, making them vulnerable to a reversal.
The Bull Bear Power Indicator for the S&P 500 Index is bullish but risks the development of a negative divergence.
Market Sentiment Analysis
Equity futures are steady this morning amid cautious optimism that the US and Iran will reach a peace deal, after US President Trump claimed that Iran has reached out following the apparent US blockade of Iranian ports. Oil dropped below $100 per barrel but remains uncomfortably high. Global consumer confidence continues to plunge, Chinese exports missed expectations, and markets will refocus on earnings season, where the AI trade will remain dominant.
Fastenal Fundamental Analysis
Fastenal is an industrial supply and stock-keeping unit with over 690,000 items. It refers to itself as a supply chain solutions company. It primarily caters to the construction and manufacturing sectors.
So, why am I bearish on FAST following its earnings release?
Fastenal’s first-quarter revenues and earnings per share met estimates of $2.2 billion and $0.30, respectively, confirming a slowdown. Gross margins clocked in 40 basis points below target and 50 basis points below last year. High-volume customers, which account for over 50% of total revenues, demand lower prices, adding to margin pressures. The outlook for the second quarter adds to selling pressure, and valuations remain excessive, while macroeconomic pressures and risk lower revenues ahead.
Metric | Value | Verdict |
P/E Ratio | 40.53 | Bearish |
P/B Ratio | 13.18 | Bearish |
PEG Ratio | 3.30 | Bearish |
Current Ratio | 4.85 | Bullish |
ROIC-WACC Ratio | Negative | Bearish |
Fastenal Fundamental Analysis Snapshot
The price-to-earning (P/E) ratio of 40.53 makes FAST an expensive stock. By comparison, the P/E ratio for the S&P 500 Index is 26.17.
The average analyst price target for FAST is $45.33. This suggests no upside potential, while downside risks are elevated.
Fastenal Technical Analysis
Today’s FAST Signal
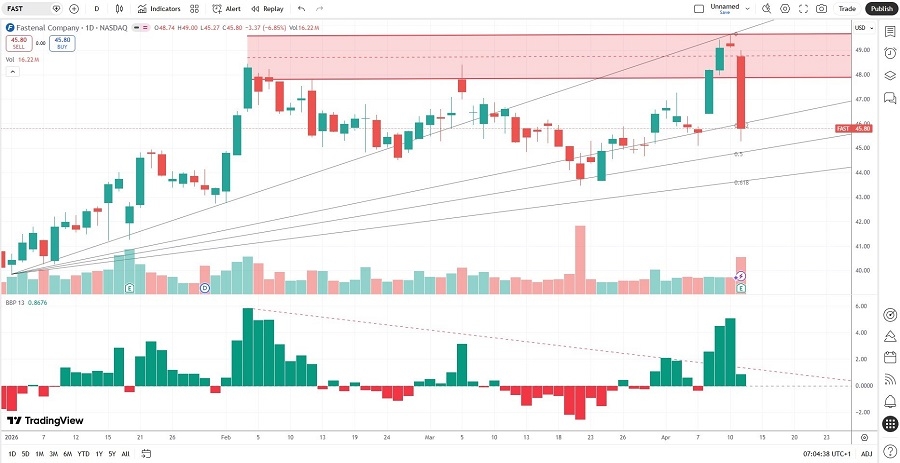
Fastenal Price Chart
The FAST D1 chart shows price action breaking down below its horizontal resistance zone.
It also shows price action between its ascending 38.2% and 50.0% Fibonacci Retracement Fan levels.
The Bull Bear Power Indicator is bullish with a descending trendline, approaching a bearish crossover.
The average bearish trading volumes are higher than the average bullish trading volumes.
FAST corrected as the S&P 500 Index moved higher, a bearish confirmation.
My FAST Short Stock Trade
FAST Entry Level: Between $45.27 and $46.95
FAST Take Profit: Between $38.44 and $39.86
FAST Stop Loss: Between $48.45 and $49.67
Risk/Reward Ratio: 2.15
Ready to trade our analysis of Fastenal? Here is our list of the best stock brokers worth checking out.