
Long Trade Idea
Enter your long position between $126.80 (the intra-day low of its previous bearish candlestick) and $130.54 (Friday’s intra-day high).
Market Index Analysis
Airbnb (NASDAQ:ABNB) is a member of the NASDAQ 100 Index and the S&P 500 Index.
Both indices continue to rebound from 2026 lows, but bullish trading volumes remain low and do not confirm the recovery.
The Bull Bear Power Indicator for the NASDAQ 100 Index is bullish but shows signs of a negative divergence forming.
Market Sentiment Analysis
Equity futures are tumbling this morning after peace talks between the US and Iran failed, and US President Trump moved from opening the Strait of Hormuz to blockading it. Oil prices spiked above $100 following the move. The first quarter earnings season could provide the next catalysts, with Goldman Sachs kicking off today. Bank of America, Wells Fargo, Citigroup, JPMorgan Chase, and Morgan Stanley will report throughout the week.
Airbnb Fundamental Analysis
Airbnb is the best-known online marketplace and broker for short-term rentals and short-term homestays. Despite its permanent ban on parties and events, the company continues to face stiff opposition to its properties in core markets. Still, it has announced plans to become an Everything App powered by AI.
So, why am I bullish on ABNB following its breakout?
I remain bullish on Airbnb due to its ongoing implementation of AI and product innovation, like using AI to match travelers with local activities, AI-powered search, and customer personalization to enhance the booking experience, and investments in marketing and customer support products. I am equally bullish on ABNB’s push into the hotel and corporate travel sector.
Metric | Value | Verdict |
P/E Ratio | 31.92 | Bullish |
P/B Ratio | 9.43 | Bearish |
PEG Ratio | 1.21 | Bullish |
Current Ratio | 1.38 | Bearish |
ROIC-WACC Ratio | Positive | Bullish |
Airbnb Fundamental Analysis Snapshot
The price-to-earnings (P/E) ratio of 31.92 makes ABNB an inexpensive stock. By comparison, the P/E ratio for the NASDAQ 100 Index is 35.43.
The average analyst price target for ABNB is $145.68. This suggests moderate upside potential with acceptable downside risks.
Airbnb Technical Analysis
Today’s ABNB Signal
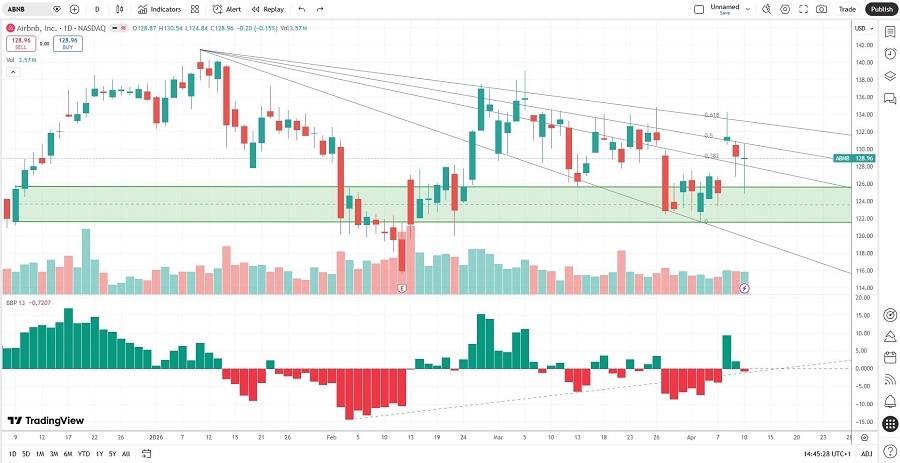
Airbnb Price Chart
The ABNB D1 chart shows price action breaking out above its horizontal support zone.
It also shows price action between its descending 38.2% and 50.0% Fibonacci Retracement Fan levels.
The Bull Bear Power Indicator turned bearish but remains above its ascending trendline.
The average bullish trading volumes are higher than the average bearish trading volumes.
ABNB moved higher with the NASDAQ 100 Index, a bullish confirmation.
My ABNB Long Stock Trade
ABNB Entry Level: Between $126.80 and $130.54
ABNB Take Profit: Between $145.68 and $148.64
ABNB Stop Loss: Between $118.13 and $119.94
Risk/Reward Ratio: 2.18
Ready to trade our analysis of Airbnb? Here is our list of the best stock brokers worth reviewing.