
Short Trade Idea
Enter your short position between $624.95 (an intermediate horizontal support level) and $644.15 (the intra-day low of its last bearish candlestick).
Market Index Analysis
- Ulta Beauty (ULTA) is a member of the S&P 500 Index.
- This index trades inside a bearish price channel with rising bearish trading volumes.
- The Bull Bear Power Indicator of the S&P 500 Index is bearish with a descending trendline.
Market Sentiment Analysis
Equity futures point to another bearish start to the trading session, building on last week’s massive sell-off, as the US-led war against Iran entered its second week. Oil futures spiked to nearly $120 per barrel as the quasi-closure of the Strait of Hormuz forced major oil producers to slash production. Should oil prices remain elevated for a prolonged period, it could tip the global economy into a recession, spike inflation, and raise borrowing costs. On the economic front, markets eagerly await Wednesday’s CPI and Friday’s PCI reports. Hewlett-Packard Enterprise, Oracle, Adobe, and Dick’s Sporting Goods highlight the earnings calendar.
Ulta Beauty Fundamental Analysis
Ulta Beauty is a cosmetics retailer offering high-end brands and mass-market products. It sells makeup, fragrance, skincare, and haircare products, and each location has a beauty salon.
So, why am I bearish on ULTA ahead of its earnings release?
Although Ulta Beauty may deliver an earnings beat this week, I turned bearish amid rising competition from Sephora and Amazon in the high-margin beauty segment. It might result in negative same-store sales and a muted outlook for 2026. I view the Space NK acquisition as a long-term positive but I also see integration challenges in the near term. Higher operating costs to maintain its market position could lower margins, adding to my bearish stance.
Ulta Beauty Fundamental Analysis Snapshot
Metric | Value | Verdict |
PE Ratio | 24.81 | Bearish |
PB Ratio | 10.89 | Bearish |
PEG Ratio | 2.74 | Bearish |
Current Ratio | 1.33 | Bearish |
ROIC-WACC Ratio | Positive | Bullish |
Ulta Beauty Fundamental Analysis Snapshot
The price-to-earnings (PE) ratio of 24.81 makes ULTA an expensive retailer stock. By comparison, the P/E ratio for the S&P 500 Index is 26.63.
The average analyst price target for ULTA is $684.38. This suggests there is limited upside potential with expanding downside risks.
Ulta Beauty Technical Analysis
Today’s ULTA Signal
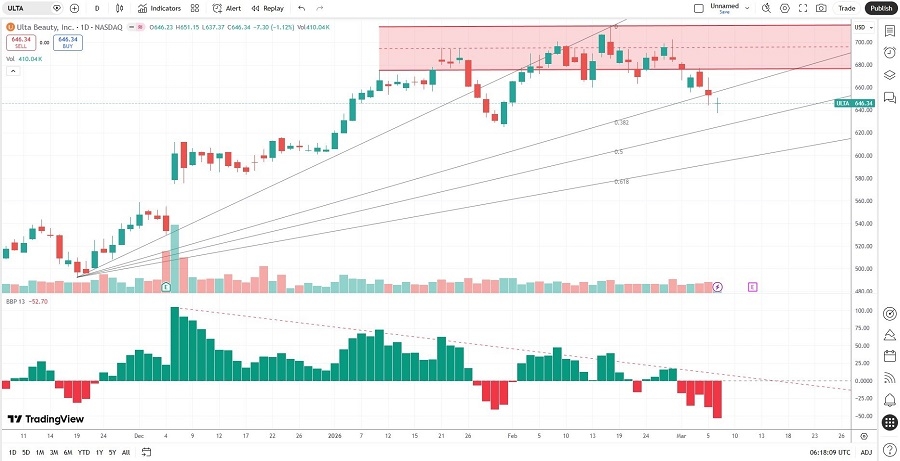
Ulta Beauty Price Chart
- The ULTA D1 chart shows price action breaking down below its horizontal resistance zone.
- It also shows price action between its ascending 38.2% and 50.0% Fibonacci Retracement Fan levels.
- The Bull Bear Power Indicator is bearish with a descending trendline.
- The average bearish trading volumes are higher than the average bullish trading volumes.
- ULTA corrected with the S&P 500 Index, a bearish confirmation.
My ULTA Short Stock Trade
- ULTA Entry Level: Between $624.95 and $644.15
- ULTA Take Profit: Between $525.35 and $543.56
- ULTA Stop Loss: Between $670.69 and $684.38
- Risk/Reward Ratio: 2.18
Ready to trade our analysis of Ulta Beauty? Here is our list of the best stock brokers worth checking out.