
Short Trade Idea
Enter your short position between $115.19 (Friday’s intra-day low) and $117.89 (Friday’s intra-day high).
Market Index Analysis
Target (TGT) is a member of the S&P 100 Index and the S&P 500 Index.
Both indices descend inside bearish price channels with rising bearish trading volumes.
The Bull Bear Power Indicator for the S&P 500 Index is bearish with a descending trendline.
Market Sentiment Analysis
Equity futures are, but volatility could reverse early gains after equity markets reached 2026 lows, and oil prices remain elevated, trading near $100 per barrel. The US attacked Kharg Island, Iran’s economic crown jewel that accounts for over 90% of its oil-related activities, while President Trump may delay his trip to China, as he hopes to pressure China into helping with securing the Strait of Hormuz. Investors also eagerly await NVIDIA’s annual GTC conference, while the Fed will hold its second policy meeting of 2026.
Target Fundamental Analysis
Target is the seventh-largest US retailer focused on upscale, trend-forward merchandise at lower costs. It operates nearly 2,000 stores and has introduced private-label brands to compete on price. It also operates 41 distribution centers and two criminal forensic labs.
So, why am I bearish on TGT following its retracement?
While Target cut prices on 3,000 products to compete with budget retailers, I turned bearish amid execution risks to its turnaround plan, which features $2 billion in expenditures in 2026. Competition is rising, applying downside pressure on margins, as Target struggles with the value perception gap against Walmart and Costco. A weakening labor market, tariff-related costs, and the impact of supply-chain shifts away from China equally threaten the medium-term outlook for TGT.
Metric | Value | Verdict |
P/E Ratio | 14.43 | Bullish |
P/B Ratio | 3.29 | Bearish |
PEG Ratio | 3.33 | Bearish |
Current Ratio | 0.94 | Bearish |
ROIC-WACC Ratio | Positive | Bullish |
Target Fundamental Analysis Snapshot
The price-to-earnings (P/E) ratio of 14.43 makes TGT an inexpensive stock. By comparison, the P/E ratio for the S&P 500 Index is 26.59.
The average analyst price target for TGT is $124.88. This suggests limited upside potential with rising downside risks.
Target Technical Analysis
Today’s TGT Signal
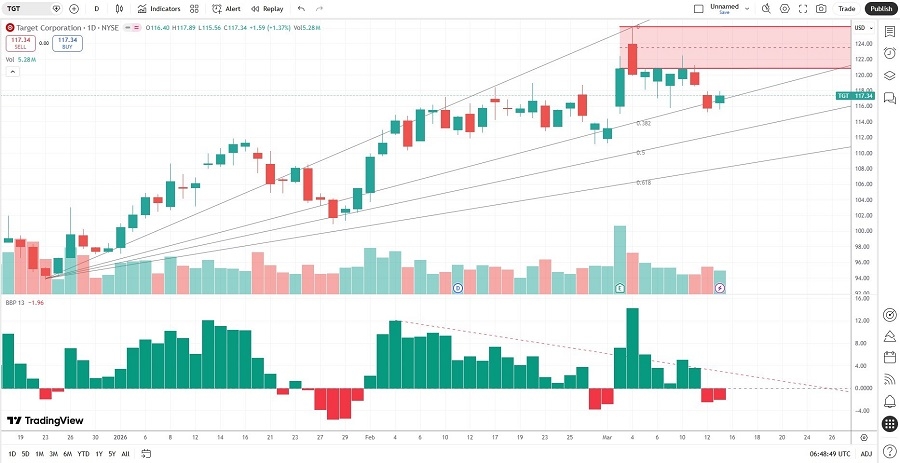
Target Price Chart
The TGT D1 chart shows price action breaking down below its horizontal resistance zone.
It also shows price action trading between its ascending 0.0% and 38.2% Fibonacci Retracement Fan.
The Bull Bear Power Indicator is bearish with a descending trendline.
The average bearish trading volumes are higher than the average bullish trading volumes, except for its post-earnings day rally.
TGT corrected less than the S&P 500 Index, a bullish signal, but bearish catalysts are rising.
My TGT Short Stock Trading Recommendation
TGT Entry Level: Between $115.19 and $117.89
TGT Take Profit: Between $93.77 and $97.18
TGT Stop Loss: Between $124.88 and $127.38
Risk/Reward Ratio: 2.21
Ready to trade our analysis of Target? Here is our list of the best stock brokers worth checking out.