
Short Trade Idea
Enter your short position between $26.78 (the intra-day high of its last bearish candlestick) and $27.17 (an intermediate horizontal resistance level).
Market Index Analysis
Pfizer (PFE) is a member of the S&P 100 Index and the S&P 500 Index.
Both indices trade inside bearish price channels with rising bearish trading volumes.
The Bull Bear Power Indicator of the S&P 500 Index is bearish with a descending trendline.
Market Sentiment Analysis
Equity futures point to another bearish start to the trading session, building on last week’s massive sell-off, as the US-led war against Iran entered its second week. Oil futures spiked to nearly $120 per barrel as the quasi-closure of the Strait of Hormuz forced major oil producers to slash production. Should oil prices remain elevated for a prolonged period, it could tip the global economy into a recession, spike inflation, and raise borrowing costs. On the economic front, markets eagerly await Wednesday’s CPI and Friday’s PCI reports. Hewlett-Packard Enterprise, Oracle, Adobe, and Dick’s Sporting Goods highlight the earnings calendar.
Pfizer Fundamental Analysis
Pfizer is a multinational pharmaceutical and biotechnology company. It specializes in immunology, oncology, cardiology, endocrinology, and neurology. PFE also ranks fifth among the most prominent biomedical companies by revenue.
So, why am I bearish on PFE despite the GLP-1 approval in China?
The approval of Pfizer’s Severwin in China provides a short-term boost, but I believe it will fail to offset the massive patent cliff for key drugs like Eliquis, Xeljanz, and Ibrance, which could wipe out $1.5 billion in revenues in 2026 and $3.0 billion in 2027. Positive Phase 3 trial results for PADCEV are overshadowed by the discontinuation of danuglipron and the pause of two Seagen pipeline assets. I am equally worried about the 2,100+ Depo-Provera lawsuits, and margin pressures despite its nearly $8 billion in planned cost cuts by 2027.
Metric | Value | Verdict |
P/E Ratio | 19.89 | Bullish |
P/B Ratio | 1.78 | Bullish |
PEG Ratio | 13.77 | Bearish |
Current Ratio | 1.16 | Bearish |
ROIC-WACC Ratio | Positive | Bullish |
Pfizer Fundamental Analysis Snapshot
The price-to-earnings (P/E) ratio of 19.89 makes PFE an inexpensive stock. By comparison, the P/E ratio for the S&P 500 Index is 26.63.
The average analyst price target for PFE is $28.43. This suggests that there is limited upside potential with rising downside risk.
Pfizer Technical Analysis
Today’s PFE Signal
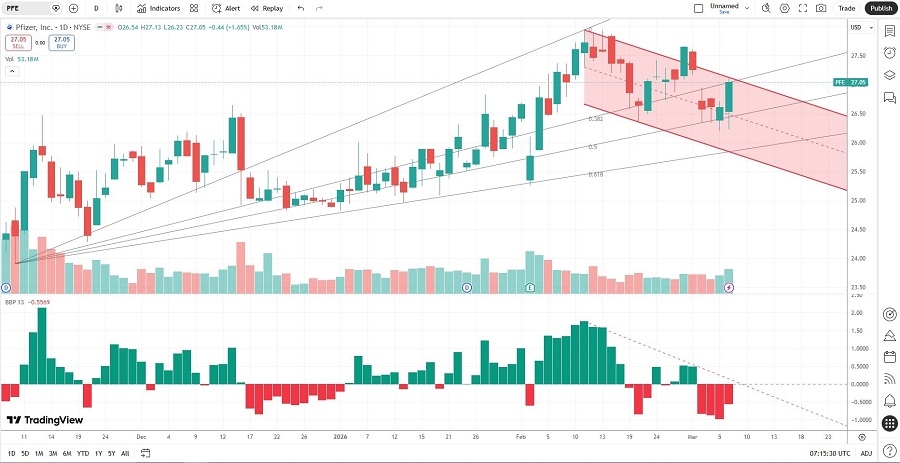
Pfizer Price Chart
The PFE D1 chart shows price action inside a bearish price channel.
It also shows price action between its ascending 38.2% and 50.0% Fibonacci Retracement Fan levels.
The Bull Bear Power Indicator is bearish with a descending trendline.
The average bearish trading volumes are higher than the average bullish trading volumes.
PFE corrected with the S&P 500 Index, a bearish confirmation.
My PFE Short Stock Trade
PFE Entry Level: Between $26.78 and $27.17
PFE Take Profit: Between $23.11 and $23.91
PFE Stop Loss: Between $27.94 and $28.43
Risk/Reward Ratio: 3.16
Ready to trade our analysis of Pfizer? Here is our list of the best stock brokers worth checking out.