
Long Trade Idea
Enter your long position between €78.83 (the lower band of its horizontal support zone) and €82.95 (the upper band of its horizontal support zone).
Market Index Analysis
BNP Paribas (EPA:BNP) is a member of the CAC 40 Index and the Euro STOXX 50 Index.
Both indices trade at horizontal support zones with gradually decreasing downside pressures.
The Bull Bear Power Indicator for the CAC 40 Index is bearish with a positive divergence.
Market Sentiment Analysis
Equity futures are moderately higher this morning following last week’s steep selloff that dropped equity markets to 2026 lows. Investors now bet on the TACO trade to emerge as the global economy is facing the consequences of President Trump’s foreign policy, pressuring his core voter base ahead of the mid-term elections. The Magnificent Seven lost over $850 billion in market value last week, but the focus will shift to labor market data in this holiday-shortened week.
BNP Paribas Fundamental Analysis
BNP Paribas is a multinational universal bank and financial services holding company. It employs 180,000+, and has three core business areas: Commercial, Personal Banking & Services (CPBS), Investment & Protection Services (IPS), and Corporate & Institutional Banking (CIB).
So, why am I bullish on BNP amid its correction?
BNP Paribas raised its mid-term profitability targets during its last earnings beat and announced an additional €600 million in cost savings for 2026. I am bullish on its CIB division, which performed exceptionally well despite market challenges, especially in debt capital markets. I am equally bullish on the pending €5.1 billion acquisition closure of AXA Investment Managers, which should boost its asset management unit.
Metric | Value | Verdict |
P/E Ratio | 7.88 | Bullish |
P/B Ratio | 0.72 | Bullish |
PEG Ratio | 2.50 | Bullish |
Current Ratio | Unavailable | Bearish |
ROIC-WACC Ratio | Negative | Bearish |
BNP Paribas Fundamental Analysis Snapshot
The price-to-earning (P/E) ratio of 7.88 makes BNP.PA an inexpensive stock. By comparison, the P/E ratio for the CAC 40 Index is 19.13.
The average analyst price target for BNP.PA is €101.35. This suggests there is some upside potential here, alongside reasonable downside risks.
BNP Paribas Technical Analysis
Today’s BNP Signal
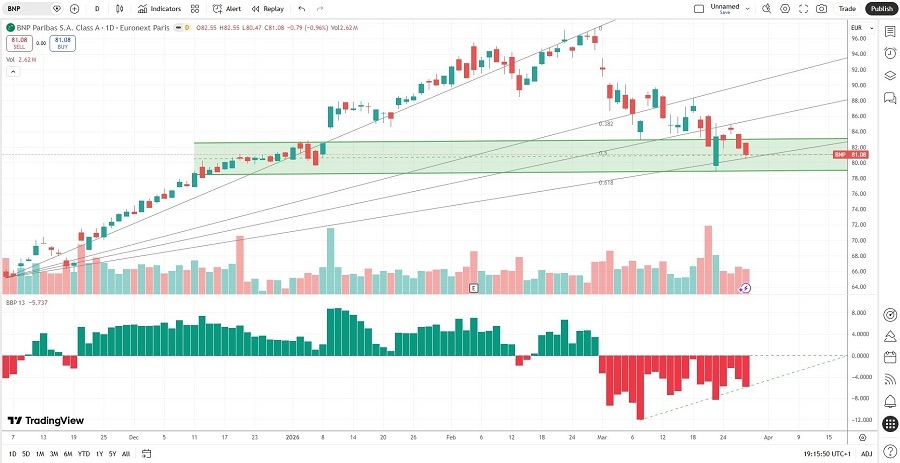
BNP Paribas Price Chart
The BNP D1 chart shows price action inside a horizontal support zone.
It also shows price action between its ascending 50.0% and 61.8% Fibonacci Retracement Fan levels.
The Bull Bear Power Indicator is bearish with a positive divergence.
The average bearish trading volumes are higher than the average bullish trading volumes, suggesting short-term volatility ahead.
BNP.PA corrected with the CAC 40 Index, a bearish confirmation, but bullish factors are accumulating.
My BNP Long Stock Trade
BNP.PA Entry Level: Between €78.83 and €82.95
BNP.PA Take Profit: Between €97.35 and €101.35
BNP.PA Stop Loss: Between €69.65 and €71.50
Risk/Reward Ratio: 2.02
Ready to trade our analysis of BNP? Here is our list of the best brokers in France worth reviewing.