
Long Trade Idea
Enter your long position between $218.41 (Friday’s intra-day low) and $221.64 (Friday’s intra-day high).
Market Index Analysis
- Republic Services (RSG) is a member of the S&P 500 Index.
- This index trades inside bearish chart patterns with rising bearish catalysts.
- The Bull Bear Power Indicator of the S&P 500 is bearish with a descending trendline, hinting at more downside potential.
Market Sentiment Analysis
Equity futures are pointing higher following Friday’s massive rally that pushed the Dow Jones Industrial Average above the 50,000 level for the first time. Concerns over tech companies’ capital expenditures, the impact of AI on software companies, and a weak labor market continue to put downside pressure on the market. The delayed January NFP report, scheduled for release on Wednesday, the January CPI, and earnings from Coca-Cola, McDonald’s, Cisco, and ON Semiconductor highlight a busy week. Last week’s sell-off in software companies reignited fears in the $3 trillion private credit market, a risk factor markets have mostly ignored for now.
Republic Services Fundamental Analysis
Republic Services is the second-largest US waste disposal company by revenue. It conducts non-hazardous solid waste collection, waste transfer, waste disposal, recycling, and energy services. It also operates 79 landfill gas-to-energy and other renewable energy projects.
So, why am I bullish on RSG ahead of its earnings release?
Republic Services maintains operational leverage despite volume headwinds, and I remain bullish about its pricing power, margin expansion, and strategic acquisitions, including the Shamrock Environmental deal. I am equally bullish about its investments in renewable natural gas (RNG) projects and on the transition of its polymer centers into revenue generators, such as the Indianapolis Polymer Center. RSG is a free cash flow machine, which supports its long-term capital allocation strategy. So, I expect RSG to beat earnings on the top and bottom line with a favorable outlook.
Metric | Value | Verdict |
P/E Ratio | 32.68 | Bearish |
P/B Ratio | 5.74 | Bearish |
PEG Ratio | 3.21 | Bearish |
Current Ratio | 0.58 | Bearish |
ROIC-WACC Ratio | Positive | Bullish |
The price-to-earnings (P/E) ratio of 32.68 makes RSG an expensive stock. By comparison, the P/E ratio for the S&P 500 Index is 29.47.
The average analyst price target for RSG is $244.21. It suggests moderate upside potential with reasonable downside risks.
Republic Services Technical Analysis
Today’s RSG Signal
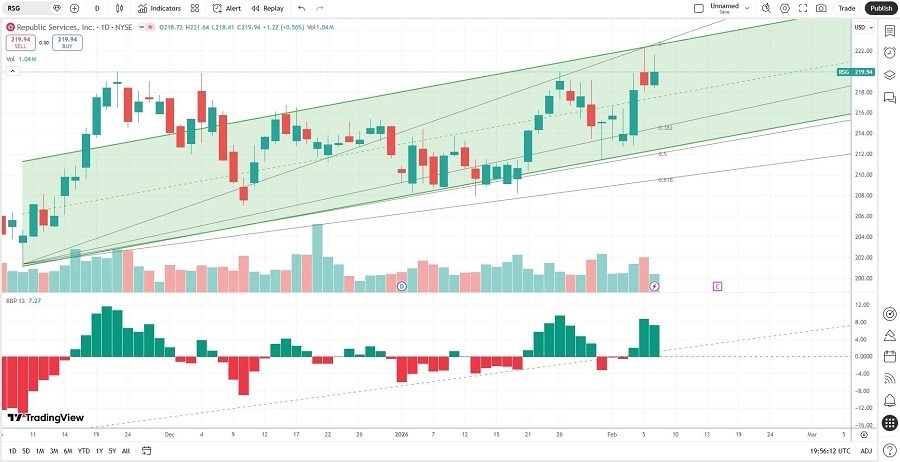
- The RSG D1 chart shows price inside a bullish price channel.
- It also shows price action between the ascending 0.0% and 38.2% Fibonacci Retracement Fan levels.
- The Bull Bear Power Indicator is bullish with an ascending trendline.
- The average bullish trading volumes are higher than the bearish trading volumes.
- RSG advanced more than the S&P 500 Index, a significant bullish confirmation.
My RSG Long Stock Trade
- RSG Entry Level: Between $218.41 and $221.64
- RSG Take Profit: Between $253.54 and $258.75
- RSG Stop Loss: Between $201.42 and $206.98
- Risk/Reward Ratio: 2.07
Ready to trade our analysis of Republic Services? Here is our list of the best stock brokers worth checking out.