
Long Trade Idea
Enter your long position between $135.25 (the intra-day low of its last bearish candlestick) and $146.55 (the intra-day high of its last bearish candlestick).
Market Index Analysis
- Oracle (ORCL) is a member of the S&P 100 and the S&P 500 indices.
- Both indices trade inside bearish chart patterns with rising bearish catalysts.
- The Bull Bear Power Indicator of the S&P 500 is bearish with a descending trendline, hinting at more downside potential.
Market Sentiment Analysis
Equity futures are pointing higher following Friday’s massive rally that pushed the Dow Jones Industrial Average above the 50,000 level for the first time. Concerns over tech companies’ capital expenditures, the impact of AI on software companies, and a weak labor market continue to put downside pressure on the market. The delayed January NFP report, scheduled for release on Wednesday, the January CPI, and earnings from Coca-Cola, McDonald’s, Cisco, and ON Semiconductor highlight a busy week. Last week’s sell-off in software companies reignited fears in the $3 trillion private credit market, a risk factor markets have mostly ignored for now.
Oracle Fundamental Analysis
Oracle is among the 20 largest companies in the world, selling database software, enterprise applications, and cloud infrastructure and hardware. It is also a member of the US-based Stargate joint venture with OpenAI, SoftBank, and MGX.
So, why am I bullish on ORCL following its 60%+ correction?
I turned bullish on Oracle after its massive sell-off brought valuations to a reasonable level, supported by its $523 billion Remaining Performance Obligation (RPO) backlog. Oracle expects to convert roughly 33% of its RPO backlog into revenues this year. The RPO backlog is not speculative demand but backed by contracts with significant AI and software firms, including Meta, NVIDIA, OpenAI, and TikTok. Its ability to raise funds to build out its AI infrastructure, tied directly to signed deals, shows institutional confidence in Oracle. Its 5-year PEG ratio also suggests the company is undervalued.
Metric | Value | Verdict |
P/E Ratio | 26.90 | Bullish |
P/B Ratio | 13.70 | Bearish |
PEG Ratio | 1.12 | Bullish |
Current Ratio | 0.91 | Bearish |
ROIC-WACC Ratio | Positive | Bullish |
The price-to-earnings (P/E) ratio of 26.90 makes ORCL an inexpensive stock. By comparison, the P/E ratio for the S&P 500 is 29.47.
The average analyst price target for ORCL is $276.30. This suggests excellent upside potential with decreasing downside risks.
Oracle Technical Analysis
Today’s ORCL Signal
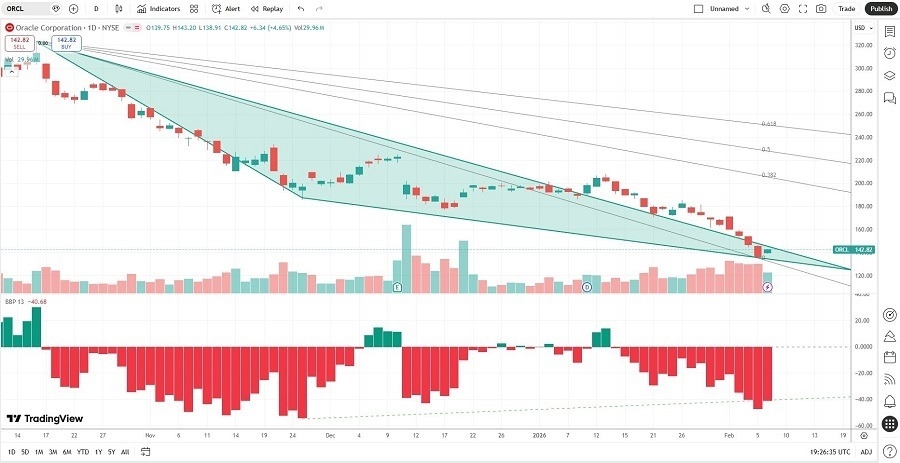
- The ORCL D1 chart shows price action inside a triangle formation with a pending breakout.
- It also shows price action between its descending 0.0% and 38.2% Fibonacci Retracement Fan levels.
- The Bull Bear Power Indicator is bearish with a positive divergence.
- The average bearish trading volumes are higher than average bullish trading volume but could be near exhaustion.
- ORCL corrected more than the S&P 500, a bearish confirmation, but breakout catalysts continue to accumulate
My ORCL Long Stock Trade
- ORCL Entry Level: Between $135.25 and $146.55
- ORCL Take Profit: Between $201.69 and $207.80
- ORCL Stop Loss: Between $118.86 and $127.99
- Risk/Reward Ratio: 4.05
Ready to trade our analysis of Oracle? Here is our list of the best stock brokers worth checking out.