

Short Trade Idea
Enter your short position between $187.47 (the lower band of its horizontal resistance zone) and $194.49 (the upper band of its horizontal resistance zone).
Market Index Analysis
NVIDIA (NVDA) is a member of the NASDAQ 100 Index, the Dow Jones Industrial Average, the S&P 100 Index, and the S&P 500 Index.
All four indices trade within bearish chart patterns and rising bearish trading volumes.
The Bull Bear Power Indicator for the NASDAQ 100 is bearish with a descending trendline.
Market Sentiment Analysis
Equity futures are hovering near their baseline as markets await NVIDIA’s earnings report after the bell today. The TACO trade was back on yesterday, after global tariffs began at 10% rather than the 15% alternative President Trump suggested. The State of the Union address focused on more tariffs, as President Trump experienced the first political pushback over his economic policy. Traders also monitor geopolitical tensions, the Bitcoin sell-off remains in focus, and questions over the relief rally in software and cybersecurity stocks remain. Besides NVIDIA earnings, Salesforce and Snowflake will report after the bell.
NVIDIA Fundamental Analysis
NVIDIA is a semiconductor company that emerged as the leading AI company. Originally catering to gamers with high-end GPUs, it broadened into AI, and its tremendous success made it the first company to reach a $5 trillion market cap.
So, why am I bearish on NVDA ahead of its earnings report?
NVIDIA is expected to deliver an earnings beat, driven by partnership agreements and new product launches. Still, I am bearish on its outlook, as competition from AMD and Google’s Tensor Processing Units (TPUs) threatens to erode its market position. Adding to a murky revenue outlook are custom AI accelerators from Amazon and Microsoft, while NVIDIA’s relevance in China remains subdued. I am equally bearish on a potential pause in hyperscalers’ purchases amid a digestion cycle.
Metric | Value | Verdict |
P/E Ratio | 47.85 | Bearish |
P/B Ratio | 45.93 | Bearish |
PEG Ratio | 1.00 | Bullish |
Current Ratio | 4.47 | Bullish |
ROIC-WACC Ratio | Positive | Bullish |
NVIDIA Fundamental Analysis Snapshot
The price-to-earnings (P/E) ratio of 47.85 makes NVDA an expensive stock. By comparison, the P/E ratio for the NASDAQ 100 is 33.91.
The average analyst price target for NVDA is $254.54. This suggests an excellent upside potential, but downside risks are notably higher.
NVIDIA Technical Analysis
Today’s NVDA Signal
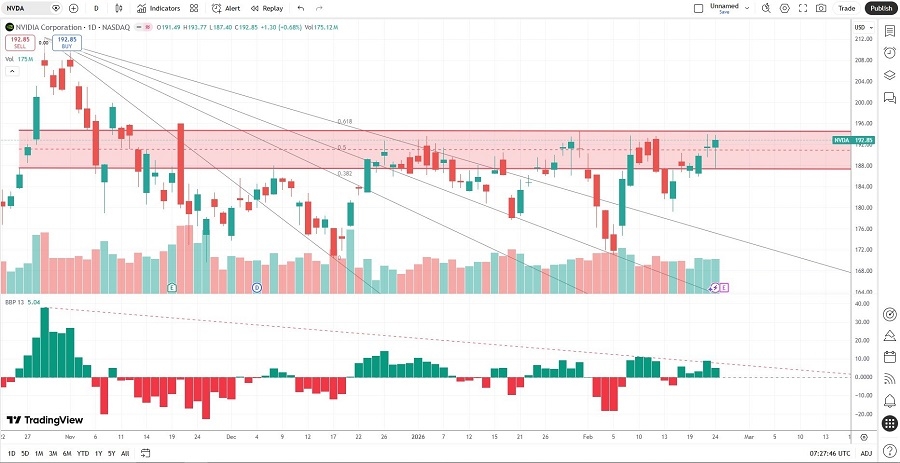
NVIDIA Price Chart
The NVDA D1 chart shows price action inside a horizontal resistance zone.
It also shows price action above its descending Fibonacci Retracement Fan.
The Bull Bear Power Indicator is bullish with a negative divergence, approaching a bearish crossover.
The average bearish trading volumes are higher than the average bullish trading volumes.
NVDA corrected less than the NASDAQ 100 Index, a bullish signal, but bearish catalysts are accumulating.
My NVDA Short Stock Trade
NVDA Entry Level: Between $187.47 and $194.49
NVDA Take Profit: Between $143.49 and $149.26
NVDA Stop Loss: Between $207.97 and $212.19
Risk/Reward Ratio: 2.15
Ready to trade our analysis of NVIDIA? Here is our list of the best stock brokers worth checking out.