
Short Trade Idea
Enter your short position between $80.58 (yesterday’s intra-day low) and $83.68 (the lower band of its horizontal resistance zone).
Market Index Analysis
- General Motors (GM) is a member of the Dow Jones Industrial Average and the S&P 100 and S&P 500 indices.
- All three indices trade near all-time highs but decreasing trading volumes do not support the uptrend.
- The Bull Bear Power Indicator of the S&P 500 turned bullish but remains below its descending trendline.
Market Sentiment Analysis
Equity futures are drifting lower after the Dow Jones Industrial Average recorded another record high, and the S&P 500 is approaching its own record. Retail sales data could inject volatility today, but tomorrow’s January NFP report remains the core economic driver this week. Earnings from Coca-Cola and volatility in gold, silver, and Bitcoin are other factors to monitor today. Despite the two-day rebound, tech companies face downside pressure from surging memory costs, which threaten profits and margins, while Alphabet plans the first 100-year bond since the dot-com era.
General Motors Fundamental Analysis
General Motors is the largest auto manufacturer in the US. It manufactures Chevrolet, Buick, GMC, and Cadillac, and owns GM Defense, which caters to the military, OnStar, ACDelco, GM Financial, and has an interest in Chinese brands Baojun and Wuling.
So, why am I bearish on GM following its breakdown?
GM struggles internationally, and its 2026 guidance includes $3.5 billion in tariff-related costs and $1.25 billion in inflation-related costs. Its 2025 EV restructuring costs of $7.9 billion show a gross miscalculation and sentiment shift, and I see more weakness ahead. The expected $1 billion in warranty costs for 2026 will decrease free cash flow, and the 5-year PEG ratio indicates the company is overvalued. I remain sceptical of its announced 2028 battery breakthrough and see GM falling behind the competition.
MGMic | Value | Verdict |
P/E Ratio | 24.67 | Bullish |
P/B Ratio | 1.25 | Bullish |
PEG Ratio | 3.73 | Bearish |
Current Ratio | 1.16 | Bearish |
ROIC-WACC Ratio | Negative | Bearish |
The price-to-earnings (P/E) ratio of 24.67 makes GM an inexpensive stock. By comparison, the P/E ratio for the S&P 500 is 29.90.
The average analyst price target for GM is $93.12, suggesting limited upside potential with increasing downside risks.
General Motors Technical Analysis
Today’s GM Signal
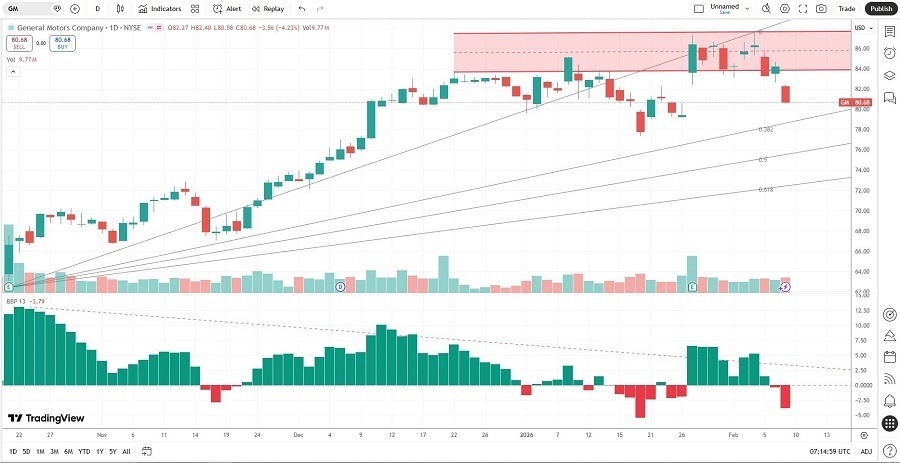
- The GM D1 chart shows price action breaking down below its horizontal resistance zone.
- It also shows price action between its ascending 0.0% and 38.2% Fibonacci Retracement Fan levels.
- The Bull Bear Power Indicator turned bearish with a descending trendline.
- The average bearish trading volumes are higher than the average bullish trading volumes.
- GM corrected as the S&P 500 Index advanced, a significant bearish confirmation.
My GM Short Stock Trading Recommendation
- GM Entry Level: Between $80.58 and $83.68
- GM Take Profit: Between $62.36 and $66.75
- GM Stop Loss: Between $89.40 and $93.12
- Risk/Reward Ratio: 2.07
Ready to trade our analysis of General Motors? Here is our list of the best stock brokers worth reviewing.