
Short Trade Idea
Enter your short position between $96.91 (the lower band of its horizontal resistance zone) and $98.58 (the upper band of its horizontal resistance zone).
Market Index Analysis
- Entergy Corporation (ETR) is a member of the S&P 500 Index.
- This index trades inside bearish chart patterns with rising bearish catalysts.
- The Bull Bear Power Indicator of the S&P 500 Index is bearish with a descending trendline, hinting at more downside potential.
Market Sentiment Analysis
Equity futures are pointing higher following Friday’s massive rally that pushed the Dow Jones Industrial Average above the 50,000 level for the first time. Concerns over tech companies’ capital expenditures, the impact of AI on software companies, and a weak labor market continue to put downside pressure on the market. The delayed January NFP report, scheduled for release on Wednesday, the January CPI, and earnings from Coca-Cola, McDonald’s, Cisco, and ON Semiconductor highlight a busy week. Last week’s sell-off in software companies reignited fears in the $3 trillion private credit market, a risk factor markets have mostly ignored for now.
Entergy Corporation Fundamental Analysis
Entergy Corporation is a utility company that provides electric power with 24,000 megawatts of generating capacity. It serves over 3,000,000 customers in Arkansas, Louisiana, Mississippi, and Texas.
So, why am I bearish on ETR ahead of its earnings?
I am bearish ahead of its earnings, as I expect a downbeat outlook amid ongoing legal expenses, regulatory headwinds, and margin contractions. Grid reliability questions and associated costs to improve its network apply downside pressure, while its ability to pass costs onto consumers remains limited. I am also bearish about its lack of financial flexibility, negative free cash flow generation, and execution risks associated with its renewable and hydrogen projects.
Metric | Value | Verdict |
P/E Ratio | 24.13 | Bearish |
P/B Ratio | 2.63 | Bearish |
PEG Ratio | 1.68 | Bullish |
Current Ratio | 0.71 | Bearish |
ROIC-WACC Ratio | Negative | Bearish |
The price-to-earning (P/E) ratio of 24.13 makes ETR an expensive stock relative to its peers but inexpensive compared to the S&P 500. By comparison, the P/E ratio for the S&P 500 is 29.47.
The average analyst price target for ETR is $105.28, suggesting negligible upside potential with rising downside risks.
Entergy Corporation Technical Analysis
Today’s ETR Signal
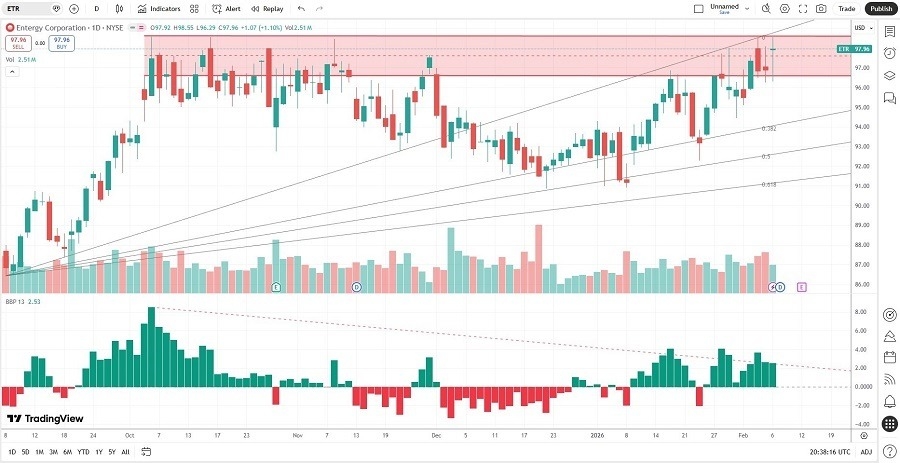
- The ETR D1 chart shows price action inside a horizontal resistance zone.
- It also shows price action trading between its ascending 0.0% and 38.2% Fibonacci Retracement Fan levels.
- The Bull Bear Power Indicator is bullish with a negative divergence.
- The average bearish trading volumes are higher than the average bullish trading volumes.
- ETR advanced more than the S&P 500 Index, a bullish confirmation, but breakdown catalysts have accumulated.
My ETR Short Stock Trade
- ETR Entry Level: Between $96.91 and $98.58
- ETR Take Profit: Between $84.21 and $86.40
- ETR Stop Loss: Between $103.17 and $105.28
- Risk/Reward Ratio: 2.03