
Long Trade Idea
Enter your long position between $122.50 (yesterday’s intra-day low) and $126.02 (yesterday’s intra-day high).
Market Index Analysis
- Airbnb (ABNB) is a member of the NASDAQ 100 Index and the S&P 500 Index.
- Both indices trade inside bearish chart patterns with decreasing bullish volumes.
- The Bull Bear Power Indicator of the NASDAQ 100 Index is bearish with a descending trendline.
Market Sentiment Analysis
Equity futures are drifting higher despite a deep divide within the US Federal Reserve over the direction of monetary policy. Despite the minutes noting the potential for interest rate hikes, markets, for now, anticipate two more interest rate cuts. The New York Federal Reserve published a paper suggesting that US consumers shoulder 90% of tariff costs, as President Trump continues to pin his success on tariffs amid an affordability crisis. Earnings from Walmart will dominate the non-tariff headlines today, after DoorDash missed expectations, and Carvana plunged in after-hours trading.
Airbnb Fundamental Analysis
Airbnb is the best-known online marketplace and broker for short-term rentals and short-term homestays. Despite its permanent ban on parties and events, the company continues to face stiff opposition to its properties in core markets. Still, it has announced plans to become an Everything App powered by AI.
So, why am I bullish on ABNB following its earnings release?
While Airbnb delivered a mixed earnings report, beating on revenue but missing on earnings per share, I turned bullish amid its AI travel pivot and upbeat first-quarter 2026 guidance. Long-term structural cost savings from its AI integration and the global launch of reserve now, pay later remain underappreciated. I am equally bullish on its Experiences and Services segment, focused on experiential and remote work-friendly stays.
Metric | Value | Verdict |
P/E Ratio | 30.84 | Bullish |
P/B Ratio | 8.87 | Bearish |
PEG Ratio | 1.60 | Bullish |
Current Ratio | 1.38 | Bearish |
ROIC-WACC Ratio | Positive | Bullish |
The price-to-earning (P/E) ratio of 30.84 makes ABNB an inexpensive stock. By comparison, the P/E ratio for the NASDAQ 100 Index is 33.11.
The average analyst price target for ABNB is $144.31. This suggests moderate upside potential with manageable downside risks.
Airbnb Technical Analysis
Today’s ABNB Signal
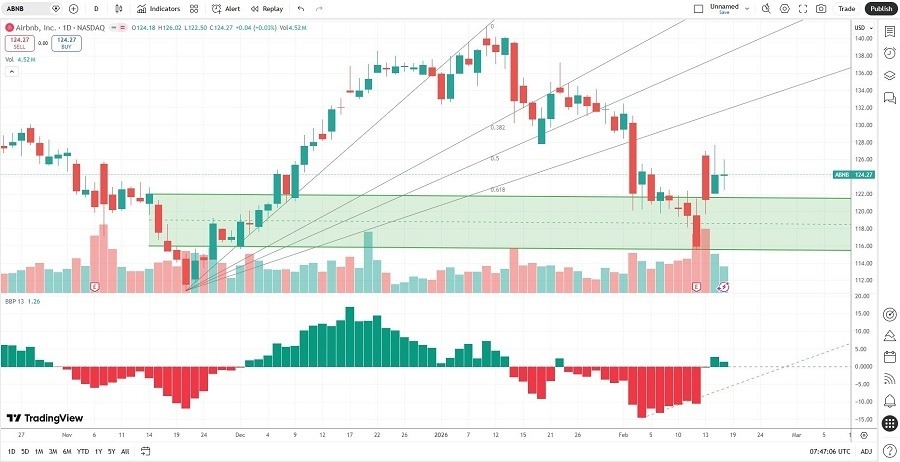
- The ABNB D1 chart shows price action breaking out above a horizontal support zone.
- It also shows price action below its ascending Fibonacci Retracement Fan.
- The Bull Bear Power Indicator turned bullish with an ascending trendline.
- The average bullish trading volumes have increased this month.
- ABNB mirrored price action in the NASDAQ 100 Index, a bullish confirmation.
My ABNB Long Stock Trade
- ABNB Entry Level: Between $122.50 and $126.02
- ABNB Take Profit: Between $141.40 and $144.25
- ABNB Stop Loss: Between $113.38 and $115.53
- Risk/Reward Ratio: 2.07
Ready to trade our analysis of Airbnb? Here is our list of the best stock brokers worth checking out.