
Short Trade Idea
Enter your short position between $218.05 (yesterday’s intra-day low) and $224.15 (yesterday’s intra-day high).
Market Index Analysis
- AbbVie (ABBV) is a member of the S&P 100 and the S&P 500 Index.
- Both indices trade in bearish chart patterns with rising downside catalysts.
- The Bull Bear Power Indicator of the S&P 500 is bullish, but below its descending trendline.
Market Sentiment Analysis
Equity futures are moving higher after January’s NFP report came in much stronger than expected. The focus is now back on the Fed, where views differ on how many interest rate increases are ahead. Still, annual revisions could show over 600,000 jobs fewer than previously reported. Friday’s CPI report will provide the next inflation snapshot. Cisco tumbled in after-hours action following the release of its earnings report, while McDonald’s also slipped. Earnings from Applied Materials and Coinbase could move markets today. Oil prices are rising amid heightened US-Iranian tensions, which may keep markets on edge.
AbbVie Fundamental Analysis
AbbVie is a pharmaceutical company ranked seventh among the largest by revenue, with a growing neuroscience presence bolstered by a robust product portfolio.
So, why am I bearish on ABBV despite its earnings beat?
Despite beating revenue and earnings per share estimates of $16.62 billion and $2.71, respectively, versus estimates of $16.41 billion and $2.65, respectively, I remain bearish, driven by an expected sales slump for Humira in the US. Valuations are excessive, and net margins have contracted by more than 15% year over year. I am also bearish on its pipeline due to uncertainty, including potential delays for Tavapadon and Capstan’s CPTX2309. Therefore, I see no near-term replacement for the Humira revenue loss and an ongoing correction. High debt levels add to concerns.
Metric | Value | Verdict |
P/E Ratio | 93.60 | Bearish |
P/B Ratio | 50.46 | Bearish |
PEG Ratio | 0.37 | Bullish |
Current Ratio | 0.66 | Bearish |
ROIC-WACC Ratio | Positive | Bullish |
The price-to-earnings (P/E) ratio of 93.60 makes ABBV an expensive stock. By comparison, the P/E ratio for the S&P 500 is 29.65.
The average analyst price target for ABBV is 245.33. It suggests moderate upside potential with rising downside risks.
AbbVie Technical Analysis
Today’s ABBV Signal
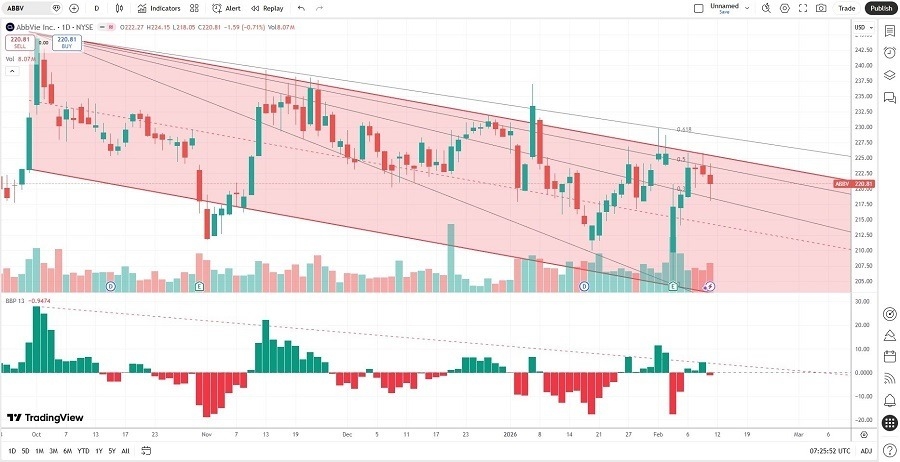
- The ABBV D1 chart shows price action inside a bearish price channel.
- It also shows price action between its descending 38.2% and 50.0% Fibonacci Retracement Fan levels.
- The Bull Bear Power Indicator turned bearish and is below its descending trendline.
- The average bearish trading volumes are rising.
- ABBV corrected as the S&P 500 pushed higher, a significant bearish trading signal.
My ABBV Short Stock Trade
- ABBV Entry Level: Between $218.05 and $224.15
- ABBV Take Profit: Between $168.06 and $176.60
- ABBV Stop Loss: Between $237.04 and $245.33
- Risk/Reward Ratio: 2.63
Ready to trade our analysis of AbbeVie? Here is our list of the best stock brokers worth reviewing.