The following are the most recent pieces of Forex technical analysis from around the world. The Forex technical analysis below covers the various currencies on the market and the most recent trends, technical indicators, as well as resistance and support levels.
Most Recent


Gold fluctuated on Monday as it stays within the same consolidation area it has been in over the last four days.
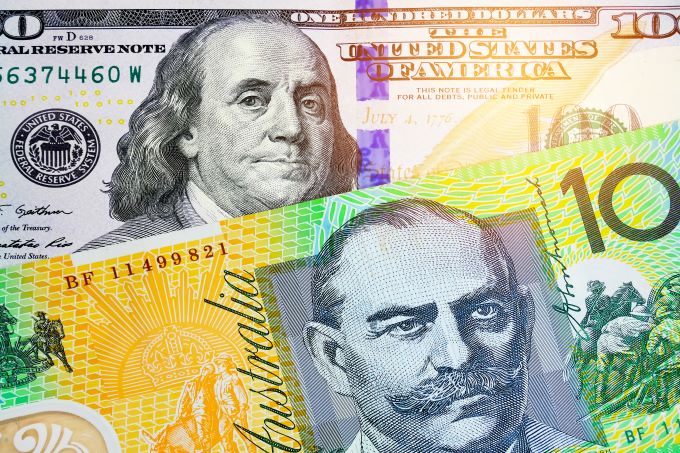
The Australian dollar fluctuated on Monday as we are still looking for some type of clarity.
Top Regulated Brokers

The Bitcoin market initially rallied on Monday but gave back a lot of the gains to form an inverted hammer, which is a potentially negative sign.

The euro initially sold on Monday, breaking well below the 1.18 level.

The British pound initially fell on Monday but then turned around to show signs of support.

The USD/BRL continues to trade in an oddly correlated trend compared to other major Forex pairs with a seemingly delayed reaction.
The AUD/USD has traversed slightly lower again today in trading, continuing its slight and incremental bearish momentum since the 7th of September.

The USD/INR has remained in the higher realms of a slightly bullish price range in the short term as broad market nervousness has been reflected in the Forex pair.
Bonuses & Promotions
.jpeg)
As of this writing, ETH/USD is trading slightly below the 3300.00 level which may be viewed as a rather nervous intersection for the cryptocurrency near term.

By the end of the week's trading, gold tried to recover above the psychological resistance of $1800, but the pressures brought it back to close around $1788.

The USD/JPY is still trying to break through the 110.00 psychological resistance to complete the upward correction.

The GBP/USD corrected upwards to the 1.3865 resistance level, a rebound from sharp losses incurred last week, which reached the support level of 1.3726.

For three trading sessions in a row, the bears have been trying to push the EUR/USD to break the 1.1800 level, which paves the way for a stronger bearish breakout.

The WTI Crude Oil markets continue to show signs of strength, but are also stymied by the downtrend line that I have marked on this chart.