.jpeg)
ETH/USD has done very little during the trading session on Monday, as we continue to see the market look as if it is threatened.
Technical Analysis
The following are the most recent pieces of Forex technical analysis from around the world. The Forex technical analysis below covers the various currencies on the market and the most recent trends, technical indicators, as well as resistance and support levels.


ETH/USD has done very little during the trading session on Monday, as we continue to see the market look as if it is threatened.
The USD/JPY rallied a bit during the trading session again against the Japanese yen on Monday, as we continue to see a lot of upward momentum.
The AUD/USD has initially rallied during the trading session to show signs of bullish pressure, breaking above the 0.69 level.
The S&P 500 plunged significantly during the trading session on Monday, as we have seen a lot of negativity.
The NASDAQ 100 has fallen hard during the trading session on Monday, as we continue to see a lot of negativity.
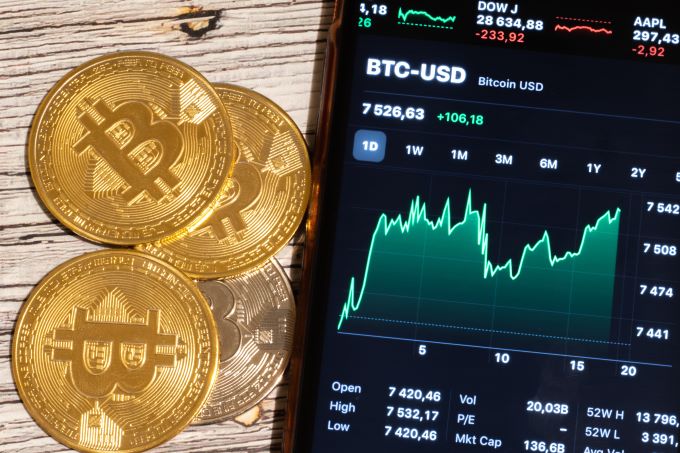
Bitcoin has drifted a little bit lower during the trading session on Monday, losing 1%.
The German index plunged drastically during the trading session on Monday, losing over 2.25%.
The Indian Rupee continues to lose ground to the USD in Forex and as of this morning a value of 79.8700 is being demonstrated.
The EUR/USD price plummets through blue sky to new 19-year lows which have not been seen since 2022, well below parity.
The Euro has broken through parity again during the trading session on Monday and has now left the parity level behind.
The BTC/USD price declined sharply as concerns about the global economy continued.
The gold markets have fallen a bit during the day on Monday to drop about two-thirds of a percent in the spot market.
The GBP/USD is traversing near the 1.17500 level as of this writing. Yesterday’s high of nearly 1.18310 began to wave early and support levels have continued to prove vulnerable.
The GBP/USD price retreated after a series of worrying news about the UK economy and as volatility jumped.
The AUD/USD price slipped to the lowest level since July 19 as worries about the Chinese economy escalated.