


Fundamental Backdrop and Market Sentiment
I wrote on 15th November that the best trades for the week would be:
Short of the EUR/USD currency pair. This pair fell over the week by 0.52%.
A summary of last week’s most important data in the market:
US FOMC Meeting Minutes – hawkish but not surprising.
US Retail Sales – no surprises.
UK CPI (inflation) - although headline inflation matched forecasts at 3.6%, services inflation unexpectedly held at 3.7% rather than rising to 3.8%, prompting investors to trim bets on a December Bank of England rate increase, which was dovish for the British Pound.
Canada CPI (inflation) - Annual inflation unexpectedly held at 3.1% rather than rising to the forecast 3.2%, while monthly inflation also undershot expectations at 0.2% versus 0.3%, which was dovish for the Loonie (Canadian Dollar).
Australia Unemployment Rate - Unemployment unexpectedly jumped to 4.9% versus a forecast of 4.7%, while employment fell by 43,500 against expectations of roughly 25,000 additional jobs, sharply weakening the case for another RBA rate increase in December. This was dovish for the Aussie (Australian Dollar).
New Zealand Inflation Expectations– no surprises.
US markets suffered a sharp acceleration in downward momentum last week, with the technology sell-off broadening into a much wider retreat from risk. The NASDAQ 100 Index plunged 10.4% over the week—its worst performance since March 2020—and briefly entered bear-market territory on Friday, trading more than 20% below its recent peak. The Nasdaq Composite lost approximately 10%, wiping out its gains for the year, while the S&P 500 Index and the Dow 30 fell 8.6% and 8%, respectively, leaving both in correction territory. The S&P 500’s seventh consecutive daily decline underlined the persistence of selling pressure: this was no longer simply weakness in a handful of expensive technology shares.
Top Regulated Brokers
NVIDIA remained at the centre of the turbulence, falling approximately 23% over the week, including a near-14% plunge on Friday after Reuters reported that US regulators were examining its accounting practices. Even stronger-than-expected quarterly results and increased guidance failed to restore confidence, illustrating how decisively sentiment has shifted against the AI trade. Anthropic’s much-anticipated flotation also failed to stabilise the sector, with its shares closing 8.5% down from the day's market open. Selling spread across chipmakers, data-centre infrastructure and software as investors questioned whether the scale and financing of AI investment could justify valuations, while the prospect of further Federal Reserve tightening added pressure to interest-rate-sensitive growth stocks.
The US Dollar remained a conspicuous source of strength as expectations of further Federal Reserve tightening combined with demand for safety during the equity sell-off, pushing the Dollar Index towards 104.00, its highest level since April 2025, roughly 19 months ago. The advance produced long-term extremes across several major pairs: EUR/USD touched a fresh 2026 low of approximately $1.0953, GBP/USD fell to around $1.3075–$1.3080, its weakest in a year, and USD/CHF reached a fresh yearly high near CHF0.8445. USD/CAD also climbed to its highest level of 2026 at approximately C$1.4355, while AUD/USD sank to a new yearly low around $0.6645. The Australian dollar faced additional pressure from a weak employment report that prompted traders to unwind expectations of another Reserve Bank of Australia rate increase and price in future cuts, sharpening the contrast with the hawkish US outlook. The yen offered a partial exception late in the week: although USD/JPY remained elevated, it retreated towards ¥158.55 on Friday as falling US Treasury yields helped the Japanese currency recover, demonstrating that the dollar’s broader strength did not translate into uninterrupted gains against every counterpart.
The Week Ahead: Key Data and Events to Watch
Next week has far fewer high-impact data points scheduled, but there will be a highly important release of US CPI (inflation) data. The coming week’s most important data points, in order of likely importance, are:
US Core PCE Price Index
US GDP
Australian CPI (inflation)
It is a public holiday in Japan on Monday and in the USA on Thursday.
Monthly Forex Forecast: November 2026 Overview
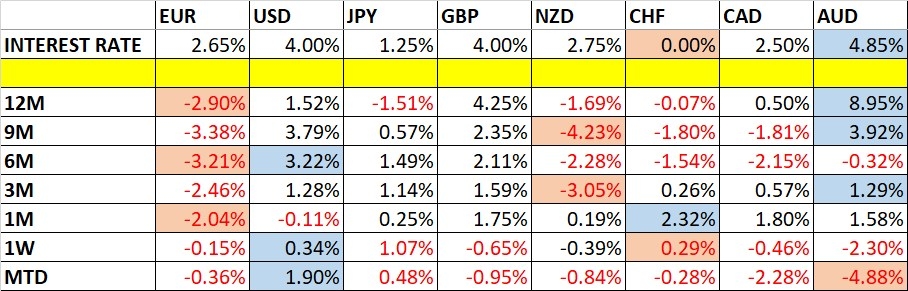
For the month of November, I forecasted that the EUR/USD currency pair will decline in value. Here is the performance to date:

Weekly Forecast 22nd November 2026
Last week, I made no weekly forecast, as there were no excessive moves in the Forex market. This week, although the AUD/JPY currency cross fell excessively, I do not forecast that it will rise over the coming week, as risk-off sentiment is approaching a level of panic. A continuing strong move lower over the coming week would not surprise me.
Volatility declined last week, with 26% of the notable currency pairs and crosses moving by more than 1% in value. Next week’s volatility is likely to be at a similar level or higher.
You can trade these forecasts in a real or demo Forex brokerage account.
Technical Overview and Key Levels
Key Support and Resistance on Major FX Pairs
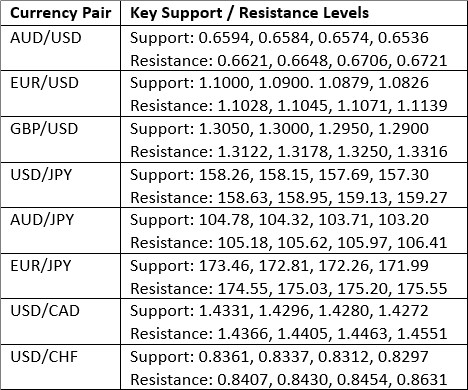
Key Support and Resistance Levels
US Dollar Index
The US Dollar Index (DXY) printed a small bullish candlestick, which closed near its high, which is a bullish sign. The price reached another new 19-month high, and broke above the former resistance level at 103.23 which were more bullish signs. The price has room to rise.
Markets are dominated by strong risk-off sentiment as most global stock markets move firmly lower, notably US tech, and money is flowing into the JPY and to a lesser extent, the USD as safe havens.
I think it is wise to look for trades that are long of the US Dollar over the coming week, as this sentiment and flow are likely to continue.
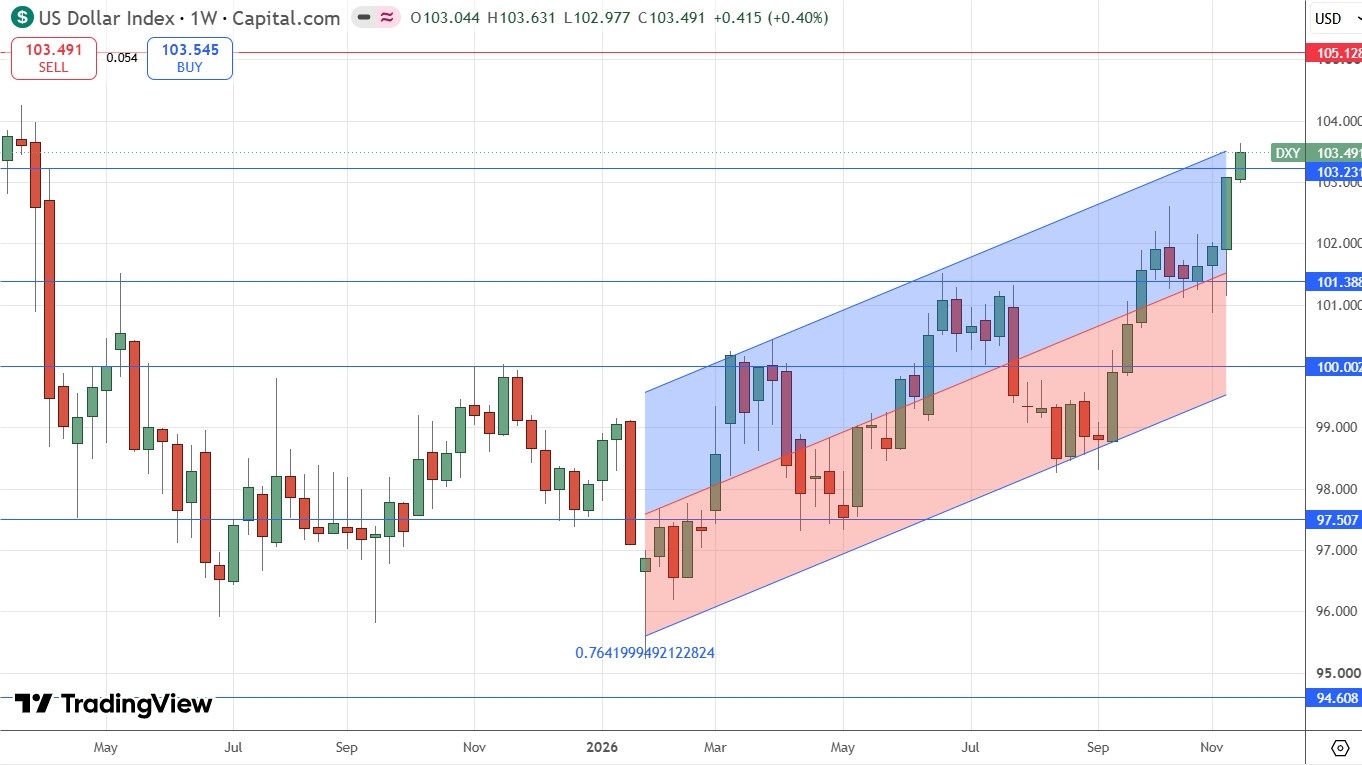
US Dollar Index Weekly Price Chart – Fresh 19-Month High
EUR/USD
The EUR/USD currency pair behaved just like the DXY did, which is not surprising as it represents a very large portion of it. Take every word I wrote above as applying here.
The price is obviously in a long-term bearish trend, and the Euro is a good vehicle to be short of against the US Dollar, as it is one of the weaker major currencies for fundamental reasons of energy and debt. The euro’s fundamental outlook remains negative, despite firmer eurozone inflation and improving economic sentiment. October headline inflation of 4.0% and an upward revision to core inflation to 2.6% have reinforced expectations of a December ECB rate increase, but that move is already largely priced in, limiting its support for the currency.
I am comfortable remaining short, especially as this currency pair has historically tended to trend very reliably.
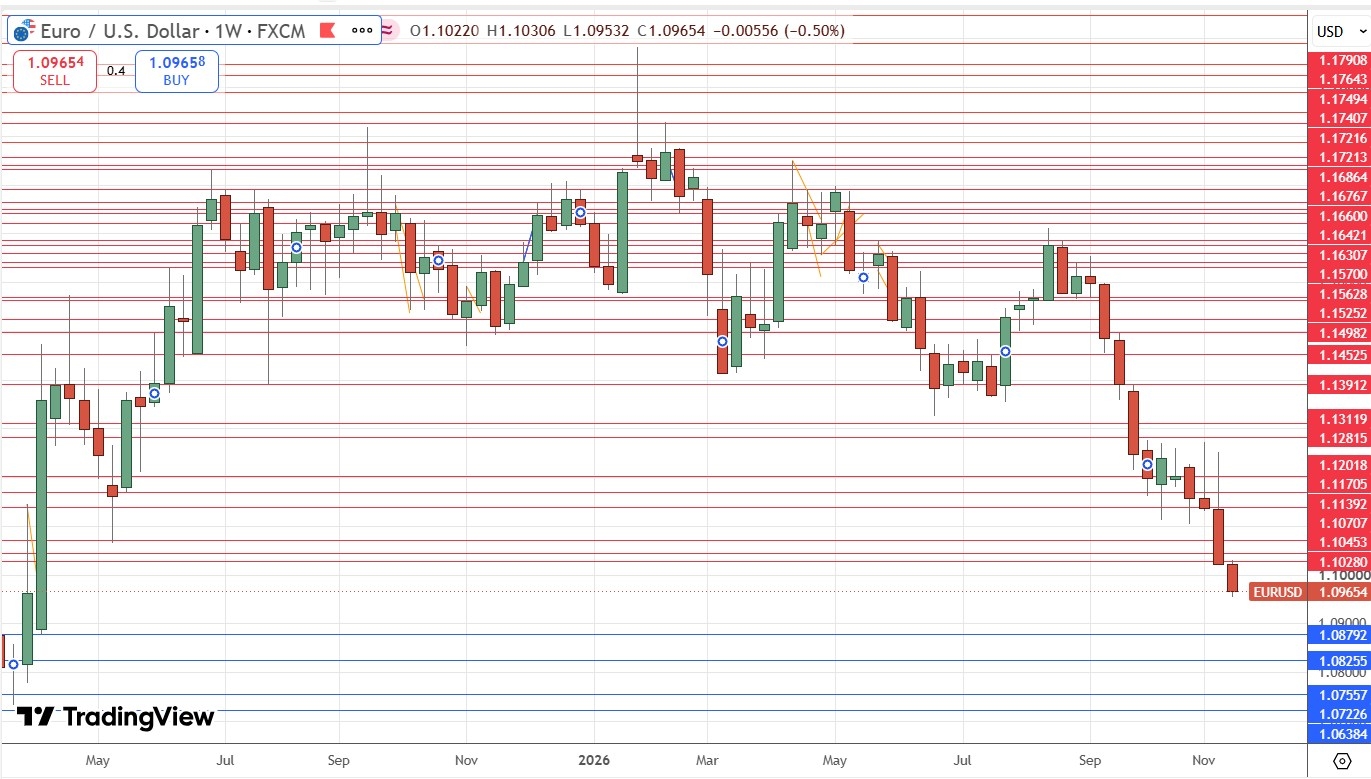
EUR/USD Weekly Price Chart – Mirroring the DXY
AUD/USD
The AUD/USD currency pair fell strongly last week, with the Australian Dollar clearly the weakest major currency in terms of the size of its relative fall in value.
There is strong bearish momentum here and in the Australian Dollar generally. This was given a boost by unexpectedly high Australian unemployment data which was released last week. Softer iron ore prices and fragile global risk appetite have added pressure – the Aussie is a commodity currency.
It seems more likely than not that we will see lower prices here over the coming week. Yet it should be traded carefully, as when volatility is quite high, there can be sudden, sharp counter-trend rebounds.
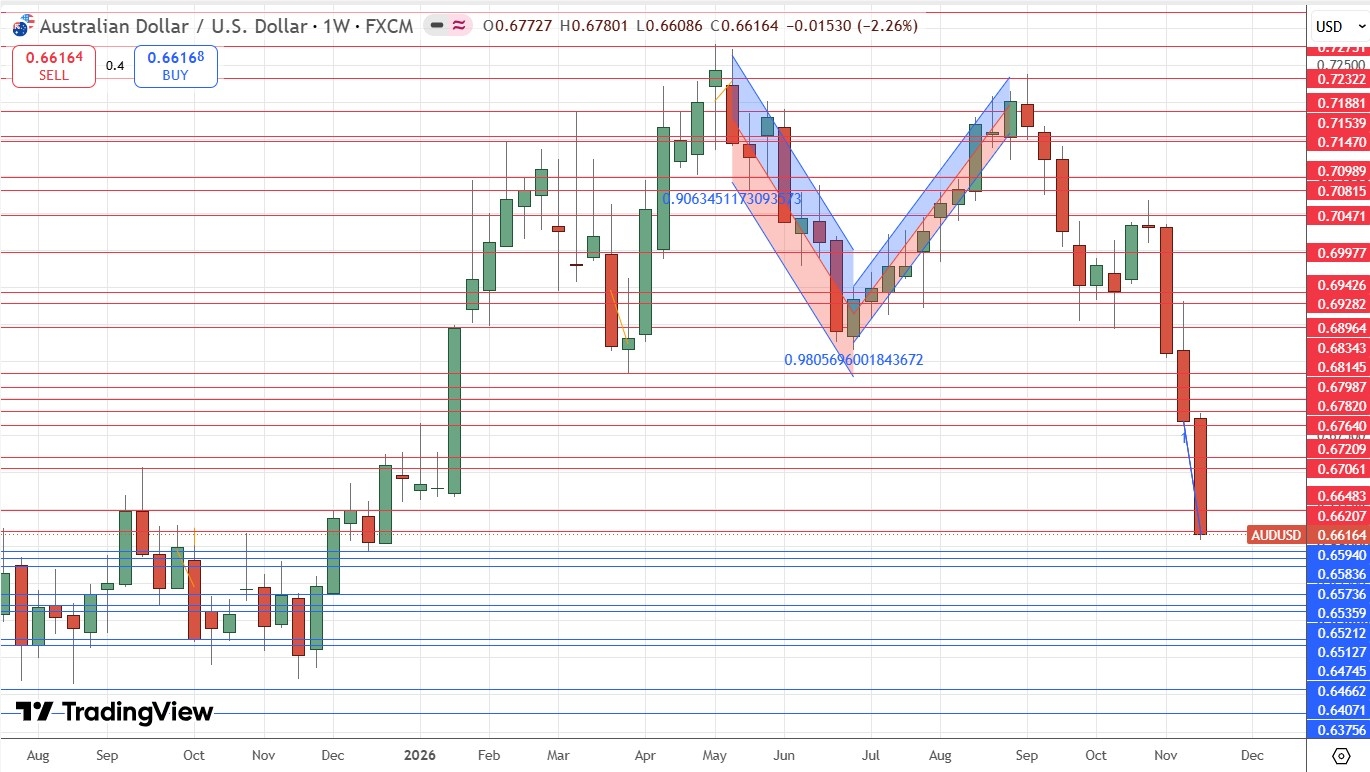
AUD/USD Weekly Price Chart – 10-Month Low Price
NASDAQ 100 Index
The broad US stock market fell strongly last week, led lower by tech, so it is no surprise that of all major indices, it was the tech-based NASDAQ 100 which suffered the most. In fact, on Friday, the price temporarily entered bear market territory by falling more than 20% from its recent all-time high, which was made as recently as last month.
It is clear there is a serious risk of further sharp falls, especially if the AI sector suffers any more scandals. Many analysts believe the sector is seriously overvalued, and after a strong bull market, a deep correction or even bear market is plausible.
We have not seen a drop this fast and sharp since the coronavirus crash of early 2020, when it fell by almost one-third.
I am always wary of shorting a stock market, or of trying to catch a falling knife, so remaining on the sidelines until the technical picture starts to show a plausible bottom is the wisest course of action.
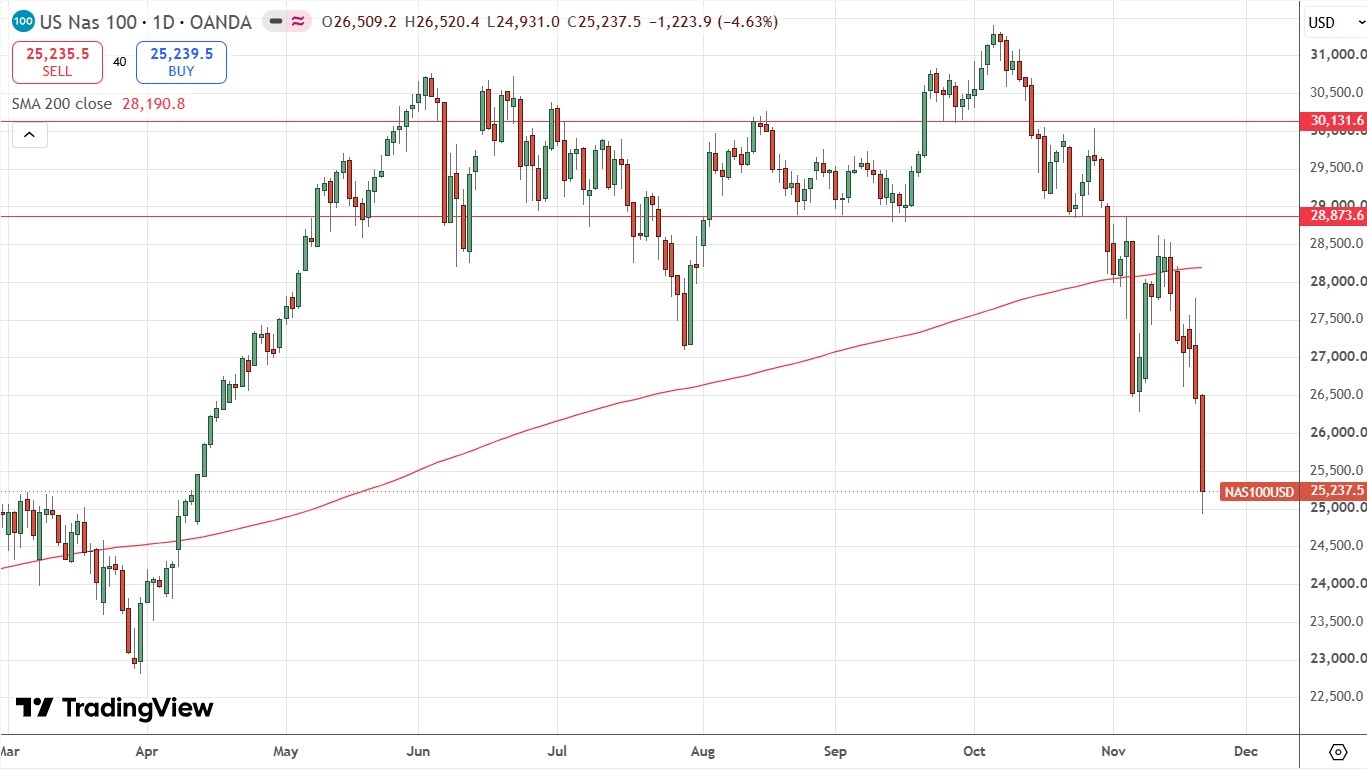
NASDAQ 100 Index Daily Price Chart – Touching a Bear Market
Bottom Line
I see the best trades this week as:
Short of the EUR/USD currency pair.
Ready to trade our weekly Forex forecast? Check out our list of the top Forex brokers.