


Fundamental Backdrop and Market Sentiment
I wrote on 11th October that the best trades for the week would be:
Long of the S&P 500 Index following a daily close above 7819. This did not set up.
Short of the EUR/USD currency pair. This pair rose over the week by 0.45%.
Long of Bitcoin following a daily close above $87,293. This did not set up.
The total loss of 0.33% averaged 0.11% per asset.
Top Regulated Brokers
A summary of last week’s most important data in the market:
US CPI (inflation) – higher than expected, with Core CPI showing a 0.3% month-on-month increase and annualized CPI showing an annualized rate of 3.7%.
US PPI – notably higher than expected.
US Retail Sales – notably higher than expected.
UK GDP – slightly higher than expected, with a 0.1% month-on-month increase while it was expected to contract by 0.1%.
Australia Unemployment Rate – was expected to fall to 4.6% but it stayed at 4.7%, putting a little pressure against the idea of further rate hikes by the RBA.
US inflation dominated last week’s trading as stronger-than-expected consumer and producer prices complicated the Federal Reserve’s policy outlook. September CPI rose 0.6% month-on-month, lifting annual inflation to 3.7%, above the 3.6% forecast, while core prices increased 0.3%, against expectations of 0.2%. Thursday’s PPI report reinforced concerns that price pressures were spreading beyond the initial energy shock: producer prices jumped 1.3% on the month and 6.3% year-on-year, the fastest annual increase since December 2022. Together, the reports strengthened the case for another Fed rate increase before year-end to 89%, although the market-implied probability for an October hike declined to only 16% according to the CME FedWatch tool.
Retail sales added to the headline picture of US economic resilience, rising 0.8% in September against expectations of 0.3%, but the underlying details were less convincing. Higher petrol-station receipts inflated the total, while sales excluding vehicles and petrol increased just 0.2% and the GDP-linked control group edged up 0.1%. The combination suggested that households were paying more without necessarily buying substantially more—a less reassuring backdrop for growth than the headline implied. The dollar initially rallied after CPI, reaching an 18-month high, before reversing as Treasury yields retreated and cautious Fed commentary tempered expectations of an immediate hike. The 10-year yield fell back towards 5.1%, illustrating how demand for the relative safety of government bonds could outweigh the inflation-driven pressure for higher yields. Its a subtle and conflicted picture.
US equities struggled with the combination of persistent inflation, potentially higher borrowing costs and mounting doubts about the financing of the artificial-intelligence boom. Technology and semiconductor shares led the weakness, with CoreWeave becoming a focal point for concerns that heavily indebted AI infrastructure companies might not generate profits quickly enough to service their obligations. Friday’s renewed selling left the S&P 500 Index down by 1.98% and the Nasdaq 100 Index down by more than 5.54%. The simultaneous weakness in stocks and recovery in Treasuries showed that investors were reassessing both equity valuations and credit risks, rather than simply trading the prospect of another Fed hike.
The Australian Dollar came under pressure after September employment unexpectedly fell by 39,300 and unemployment reached a five-year high of 4.7%, compared with expectations of 4.6%. AUD/USD fell by about 0.3% following the release as traders scaled back expectations of another Reserve Bank of Australia rate increase. With the cash rate already at 4.60% after four hikes this year, the weaker labour market strengthened the argument for allowing previous tightening more time to work. Another increase nevertheless remained possible: economists were divided, with the forthcoming quarterly inflation report likely to determine whether employment weakness would be enough to keep the RBA on hold.
Energy supply risks remained a major influence across markets, with Middle East disruptions and a larger-than-expected draw in US crude inventories supporting oil prices and adding to inflation concerns. Oil jumped more than 3% during Friday’s trading, contributing to the renewed pressure on equities, while an International Energy Agency release of diesel reserves helped ease European diesel margins. Gold benefited at times from the weaker dollar and lower Treasury yields but was still heading for a weekly loss as investors weighed the possibility of further Fed tightening. In the UK, unexpectedly positive August GDP growth of 0.1%, against forecasts of a contraction, supported sterling and reinforced expectations that the Bank of England could raise rates in November.
The Week Ahead: Key Data and Events to Watch
Next week will see only a few highly important data items. The coming week’s most important data points, in order of likely importance, are:
UK CPI (Inflation)
Canada CPI (inflation)
New Zealand CPI (inflation)
Monthly Forex Forecast: October 2026 Overview
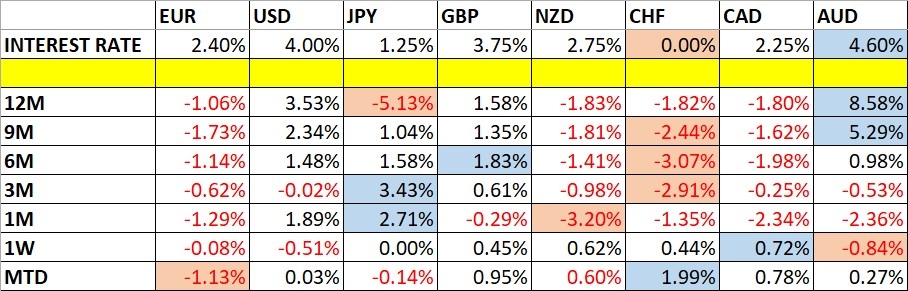
For the month of October, I forecast that the EUR/USD currency pair will decline in value. Here is the performance so far:

Weekly Forecast 18th October 2026
There were no excessive moves in currency crosses last week, so I make no forecast.
Volatility increased slightly last week, with only 11% of the notable currency pairs and crosses moving by more than 1% in value. Next week’s volatility is likely to be similar or higher.
You can trade these forecasts in a real or demo Forex brokerage account.
Technical Overview and Key Levels
Key Support and Resistance on Major FX Pairs
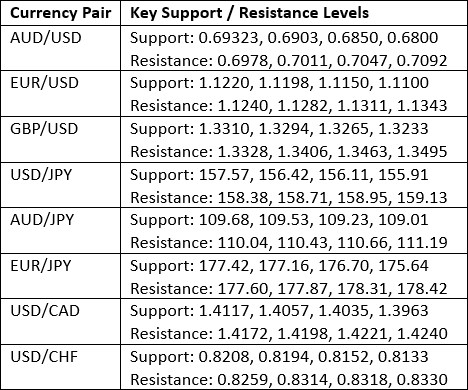
Key Support and Resistance Levels
US Dollar Index
The US Dollar Index (DXY) made a new 18-month high above 102.50 before turning sharply bearish and printing a bearish outside engulfing candlestick. Although this looks bearish, it is significant that there is clearly a long-term bullish trend, that a new high was made, and that the price did not end the week below the key support level at 101.39.
If the price holds up above 101.39 as we head into the next week, that will be a sign that the bullish trend will be likely to resume, if it does not, we may have seen a top, or at least be due a deeper bearish retracement.
The situation with the US Dollar has become strangely mixed, with US inflation-related data last week surprising to the upside, but the chances of Fed rate hikes have not materially increased, and 10-year US Treasury Yields have fallen meaningfully from their recent very long-term high. The US Dollar appears to be responding to other factors.
I still think it makes sense to be prepared to be long of the USD this week, if the DXY is above 101.39, especially if it holds above that level over the first few days of next week.
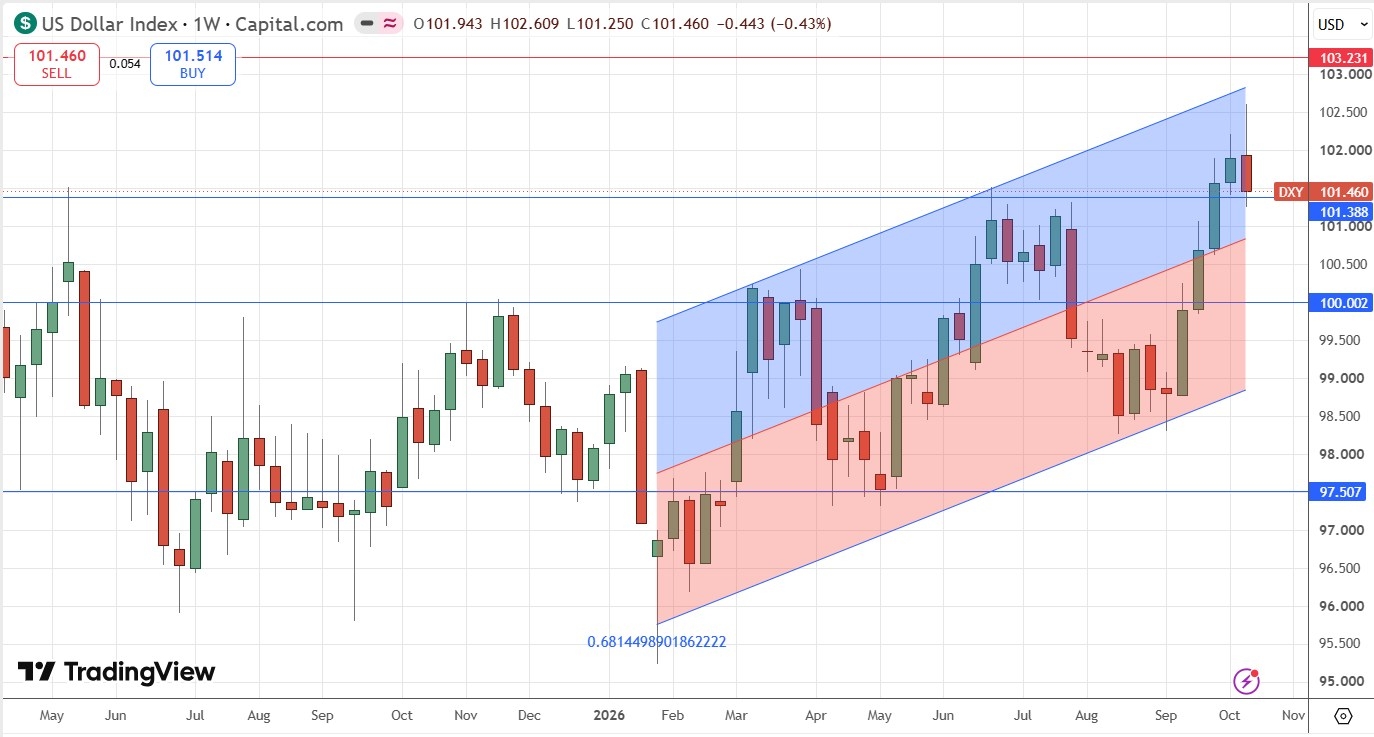
US Dollar Index Weekly Price Chart
EUR/USD
The EUR/USD currency pair initially fell again last week, making a 17-month low not far from the 1.1100 handle. The recent downwards trend has been strong, with relatively heavy bearish momentum by the standards of this currency pair. Yet after making this low, the price really bounced back and firmed up, and got established first above 1.1200 and then above the half-number at 1.1250 which was confluent with a significant zone of resistance/support.
This means we have a mixed technical picture – there is a valid long-term bearish trend that most traders will be holding onto until the price gets established above 1.1300, but a deeper bullish retracement is starting to look more likely so the idea of taking a new short trade here looks somewhat frightening.
Interestingly, the US Dollar did not rise despite higher than expected US inflation data and retail sales data last week. This is the sign that should worry US Dollar bulls.
I will remain in my short trade until we get a daily close above 1.1300. It is quite possible that the price will rise to this area and then turn bearish again, and if that happens, it could be an opportunity to enter a new short trade if that price action sets up.
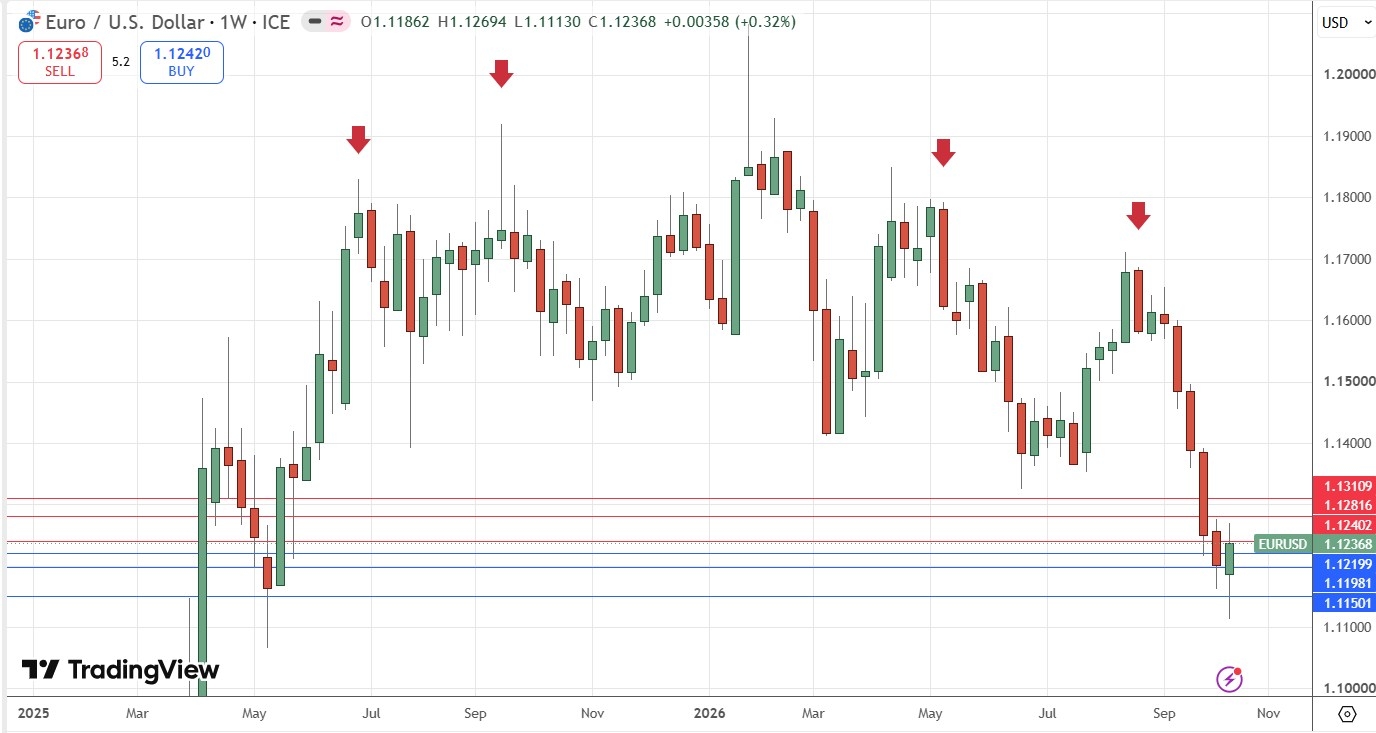
EUR/USD Weekly Price Chart
WTI Crude Oil
WTI Crude Oil has risen quite firmly over the past week, breaking out above the short-term descending trend line shown within the price chart below after finding support earlier at the key support level at $87.68 which I have been writing about recently as a potentially very important level. The price is now running into what is likely to be an area of resistance – the gap just below $100 and the big round number at $100 itself.
As has been the case for many months, what happens militarily and geopolitically in the Strait of Hormuz and in the Gulf is the main driver here, making trading unpredictable. I thought it would be more predictable as it is obvious that President Trump will not launch serious attacks on Iran until after the mid-term US election is over on 4th November. However, the Iranians are launching quite strong attacks on Saudi Arabia including oil facilities there, and this has succeeded in driving the price of crude oil higher, which is precisely one of the Iranian’s main goals in launching these attacks.
Longer-term traders might do well to look for buying opportunities if they think a resumption of the war is going to happen after the mid-terms, but they might need to be quick to take profit, as President Trump tends to make moves pretty quickly to bring down the price of Crude Oil once it exceeds $100.
I will not trade WTI Crude Oil until after the mid-term election in the USA on 3rd November completes, at which time we will probably get to see what President Trump’s true intentions towards Iran are. If he wants to make more war, he may find that increasingly difficult if the Democrats take control of the Senate – prediction market Polymarket currently shows a 65% chance of the Democrats taking control of both the House and the Senate.
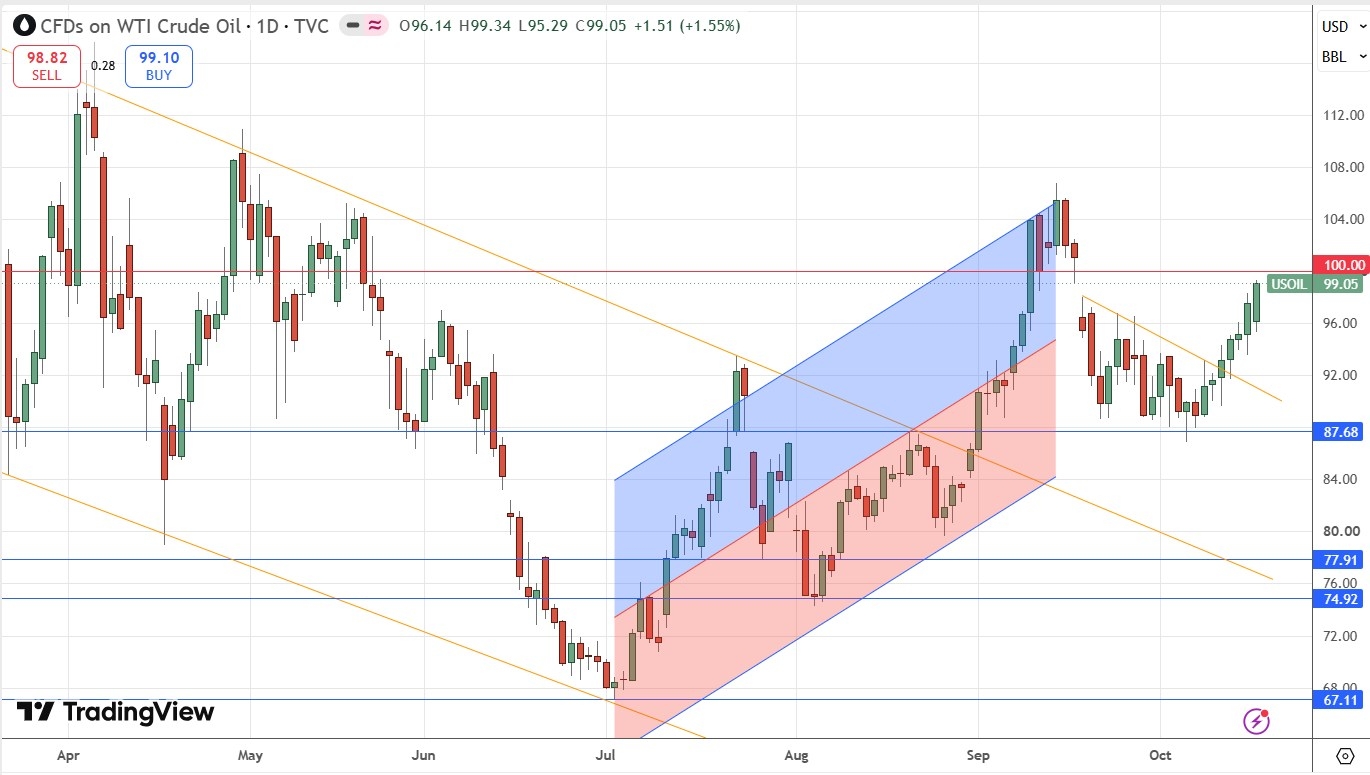
WTI Crude Oil Spot Daily Price Chart
Bitcoin
Until almost two weeks ago, Bitcoin was coiling tightly just below very key resistance at $87,293 and Ethereum was following a similar pattern. A bullish breakout to new multi-month highs and a move higher for the wider crypto asset classes was in view. However, after a few failed tests of the area, the price moved decisively lower, invalidating $82,000 as support, and threatening to break down below the big round number at $80,000.
A decisive long-term bullish breakout looks less likely now, but as long as the support at $80,000 remains intact, so there is still hope that this bullish breakout will happen – it is just a fainter hope.
If we get a daily close below $80,000, I will see that as a decisive bearish sign and exit my long trade which I entered on the first major breakout a few weeks ago. A daily close above $87,293 and we could see the price move strongly higher quite quickly, so I think in the unlikely even that sets up this week, it could be a very exciting development.
I make surely technical calls on Bitcoin – I think outside of Africa it has no practical use whatsoever. Fortunately, Bitcoin tends to respect technical factors very well.
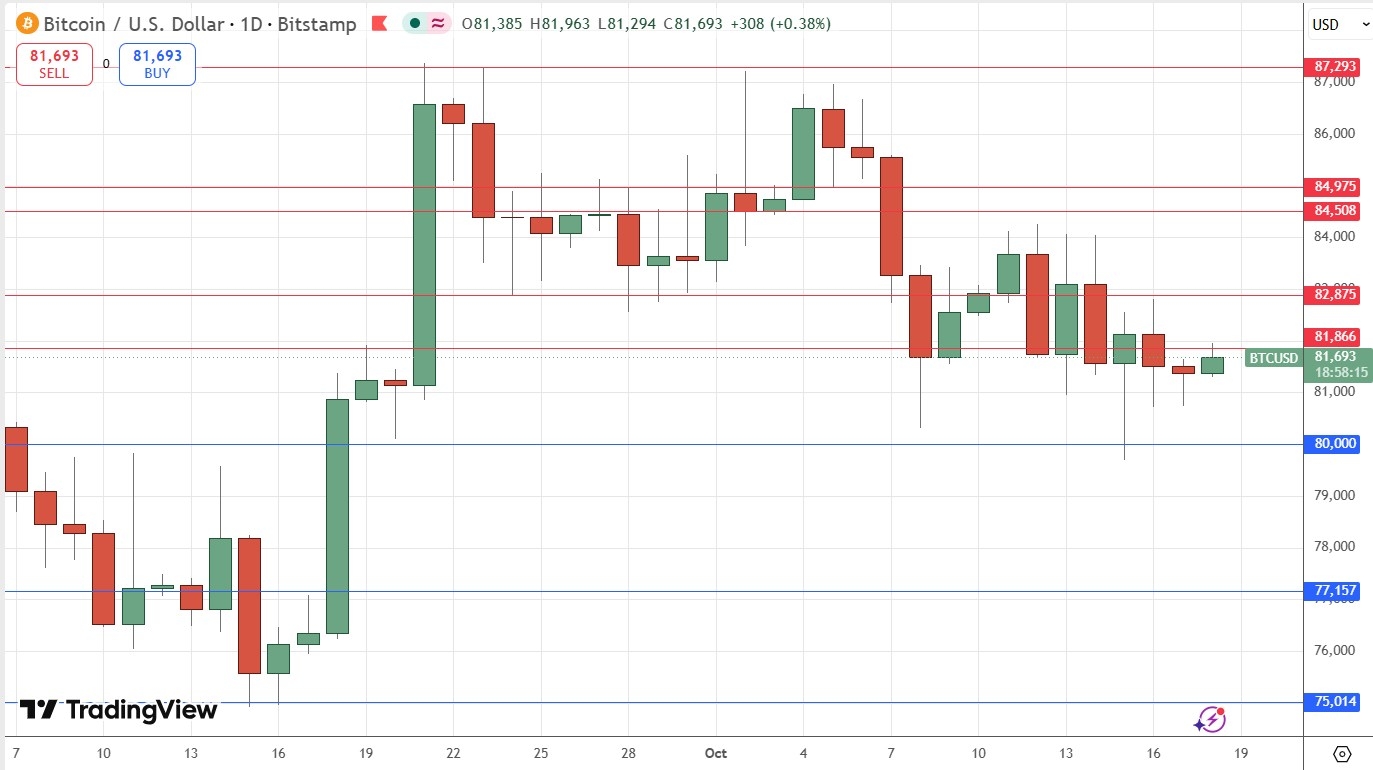
Bitcoin Daily Price Chart
NASDAQ 100 Index
The tech-based NASDAQ 100 Index fell strongly last week, by more than 5%. This was the strongest weekly fall for at least three months. Having led the recent strong bull market higher, tech now seems to be leading the market lower, with broader indices doing better but still ending the week substantially lower.
The price chart below shows major simple moving averages on the daily chart. While it is difficult to be overly bearish given that this Index made a new all-time just two weeks ago, the chart shows that we are now trading below the 100-day simple moving average (SMA) and the 200-day SMA is in sight. The price also ended the week close to an obviously potentially supportive area centred on the round number at 29,000. This might hold the price up, but if the price gets established below that level, it will be another bearish sign.
Another bearish factor is that when you look at major stocks which are components of these indices, you see that most of them are going down with many even making or approaching long-term lows. This does not necessarily signal a bear market, but it makes me worried about this dip.
It is not a good idea to short stock markets unless you are an expert trader. I don’t like to go short here, but I am certainly not going long right now.
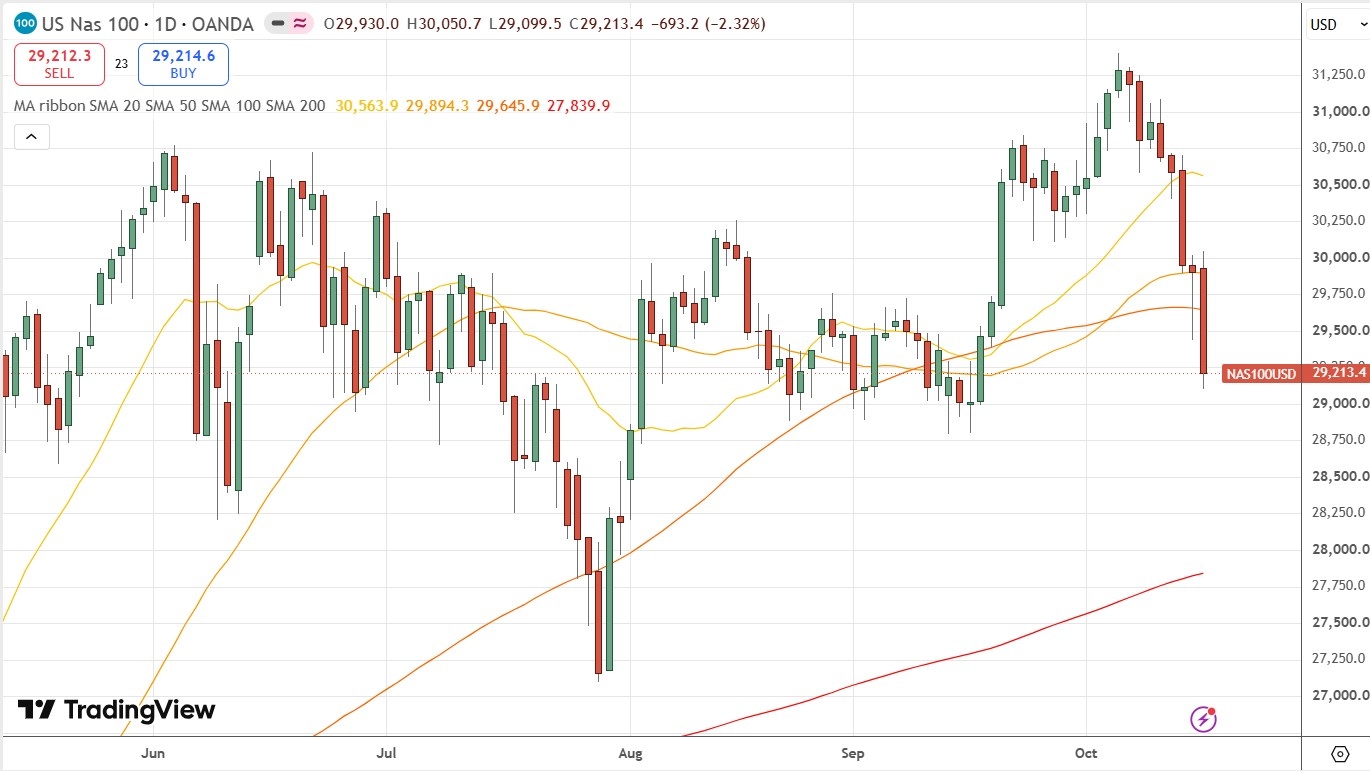
NASDAQ 100 Index Daily Price Chart
Bottom Line
I see the best trades this week as:
Short of the EUR/USD currency pair below 1.1300.
Long of Bitcoin following a daily close above $87,293.
Ready to trade our Forex weekly forecast? Check out our list of the best Forex brokers.