


Bearish view
Sell the GBP/USD pair and set a take-profit at 1.3150.
Add a stop-loss at 1.3300.
Timeline: 1-2 days.
Bullish view
Buy the GBP/USD pair and set a take-profit at 1.3300.
Add a stop-loss at 1.3150.
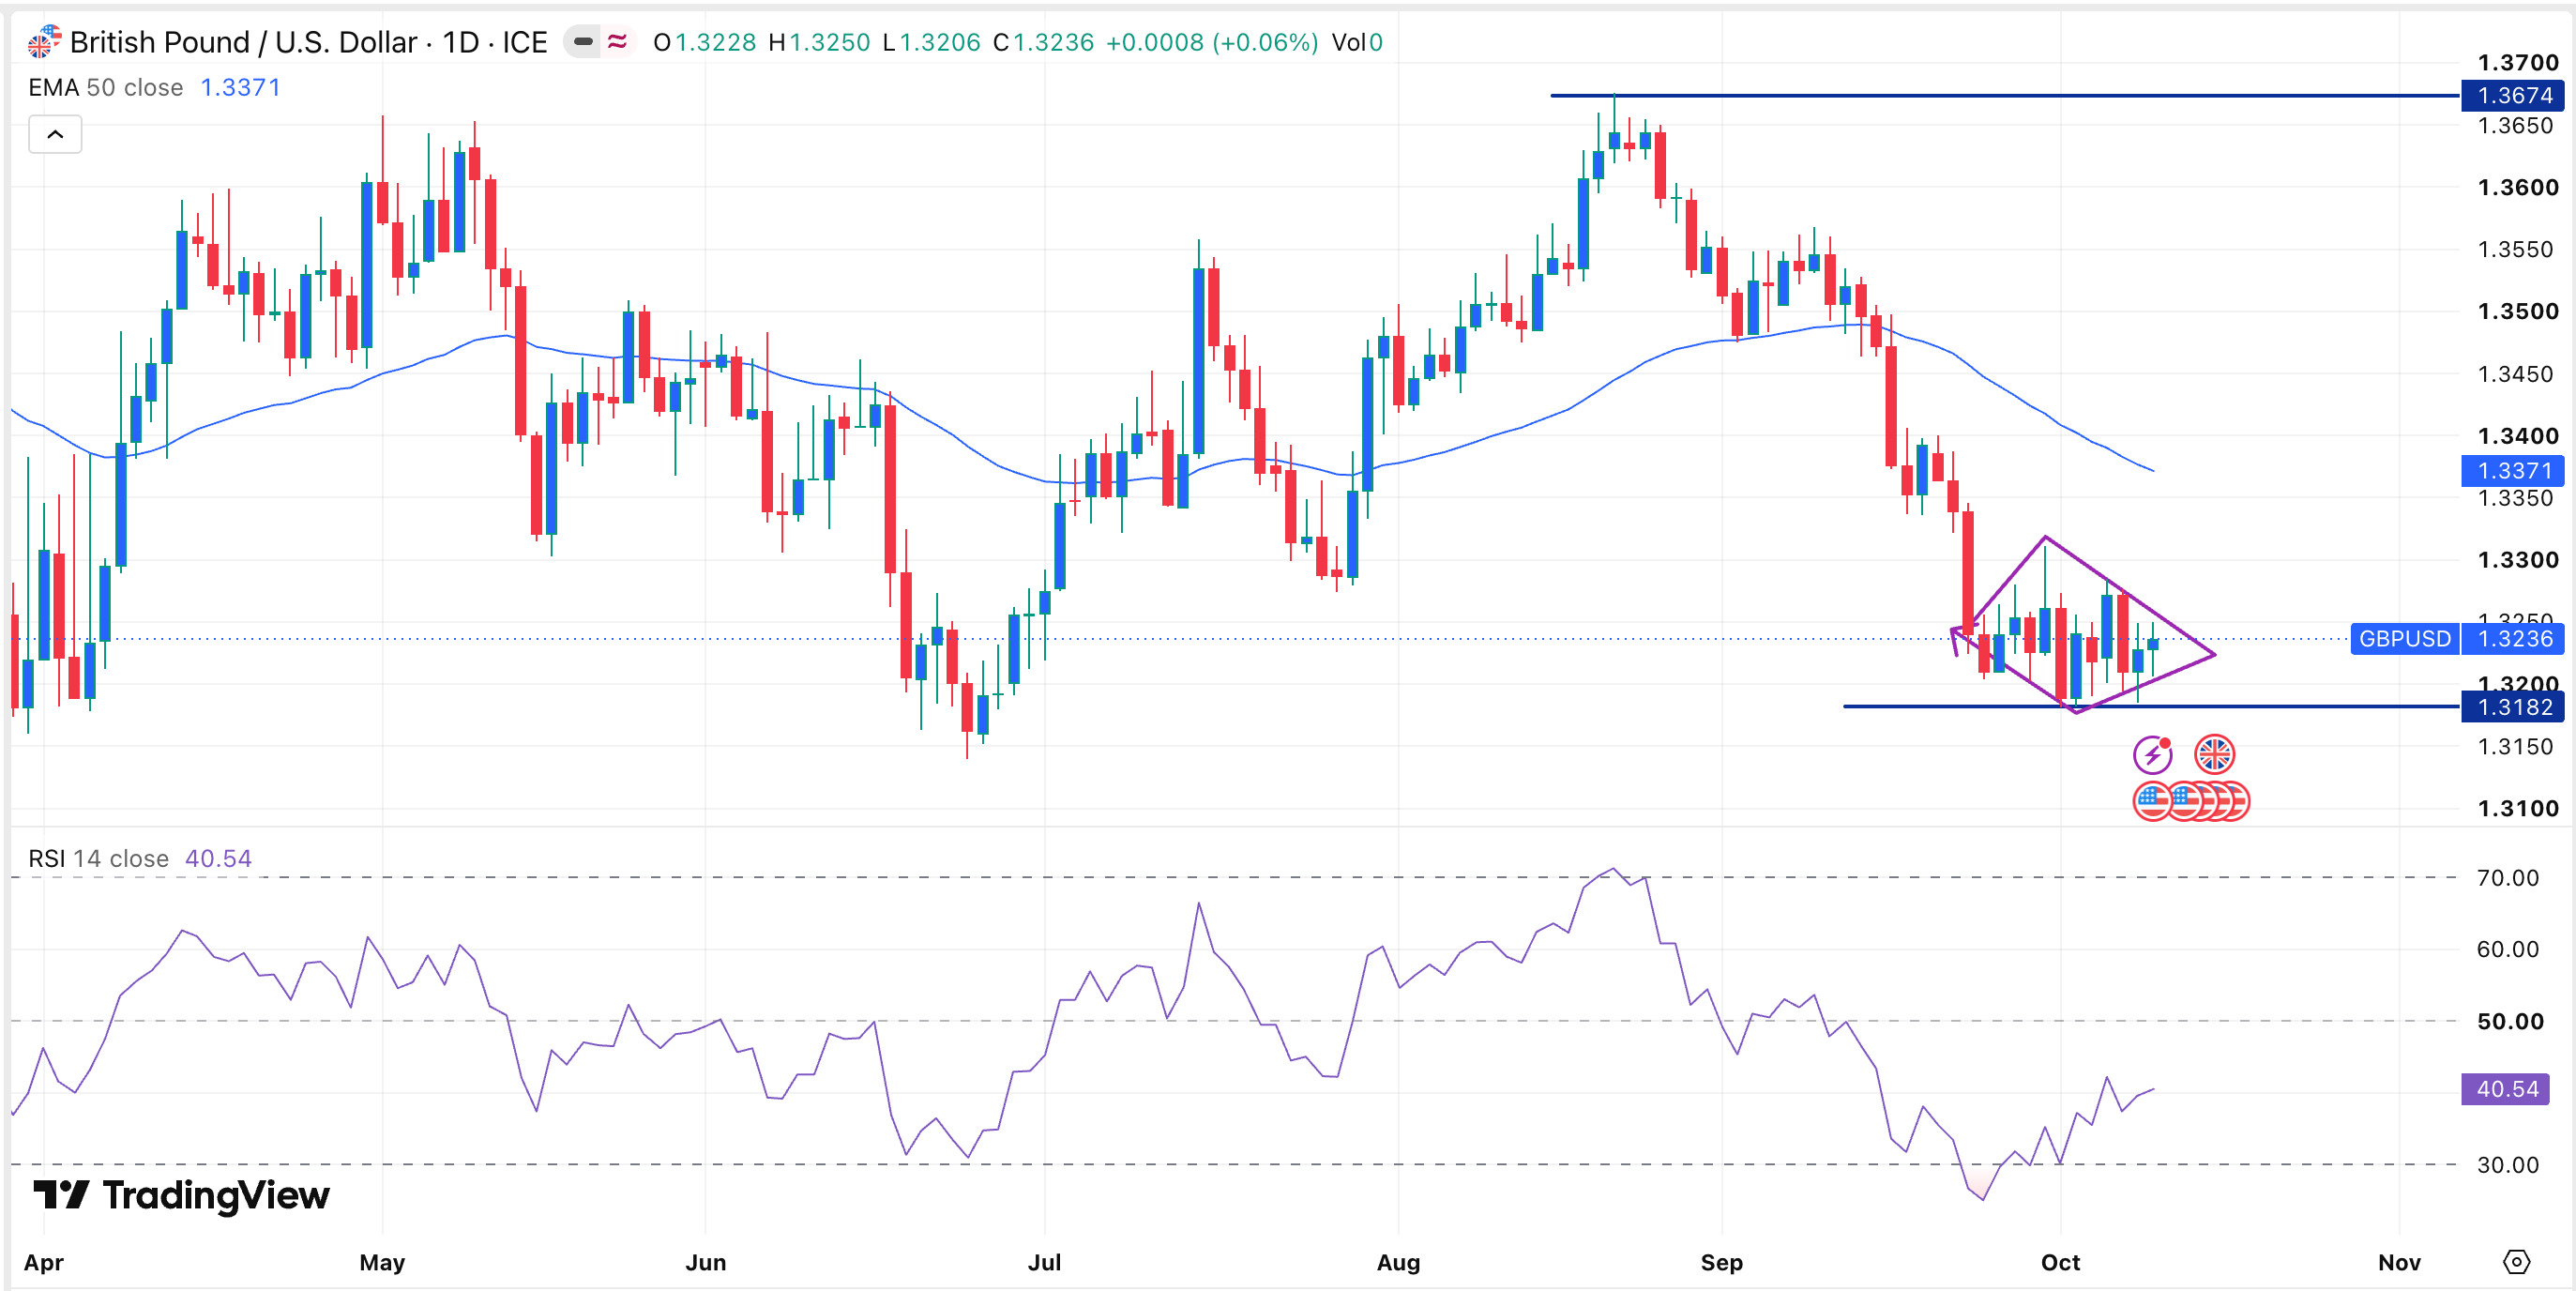
The GBP/USD pair wavered on Monday as traders focused on the ongoing tensions in the Middle East that have pushed crude oil prices higher. It was trading at 1.3236 on Monday, a few points above this month’s low of 1.3182.
Top Regulated Brokers
US Consumer Inflation Report Ahead
The GBP/USD pair has come under pressure in the past few weeks. It wavered as investors US and UK bond yields continued rising. In the US, the ten-year yield jumped to 5.3%, while the five-year rose to 5.03%.
Similarly, in the UK, the ten-year Gilts soared to 5.52%, its highest level in years. It has soared from a low of 4.235% last year, and this upward trend may continue in the foreseeable future.
The pair will have some major catalysts this week. The most notable one will come out on Wednesday when the US publishes the latest consumer inflation report. Economists expect the data to show that the headline CPI rose from 3.4% in August to 3.6% in September. Core inflation, which excludes the volatile food and energy prices is expected to come in at 2.6%, moving further away from the Fed’s target of 2%.
These numbers will help market participants to predict what the Federal Reserve will do in the next few meetings. Following the release of the recent nonfarm payrolls (NFP) data, economists reduced their Fed rate hike expectations for the year. A higher-than-expected inflation report may lead to higher hopes that the Fed will hike rates at least once this year.
The other key catalyst for the pair will be the upcoming UK GDP, manufacturing, and industrial production numbers. Economists expect the data to show that the British economy did well in August. Odds of the BoE hiking interest rates this year have jumped recently.
GBP/USD Technical Analysis
The daily chart shows that the GBP/USD pair has come under pressure in the past few weeks. It dropped from a high of 1.3674 in August to a low of 1.3182 last week.
A closer look at this chart shows that it is sending mixed signals. It has remained below the 50-day Exponential Moving Average (EMA), a sign that bears remain in control.
On the other hand, the Relative Strength Index (RSI) has continued rising and is slowly nearing the neutral level of 50. That is a sign that it has formed a bullish divergence pattern. It is also slowly forming a diamond reversal pattern.
Therefore, the pair may move in either direction. A drop below the support of 1.3182 will point to more downside over time.
Ready to trade our free trading signals? We’ve made a list of the best UK forex brokers worth using.