


Bullish view
Buy the BTC/USD pair and set a take-profit at 87,000.
Add a stop-loss at 79,000.
Timeline: 1-2 days.
Bearish view
Sell the BTC/USD pair and set a take-profit at 79,000.
Add a stop-loss at 87,000.
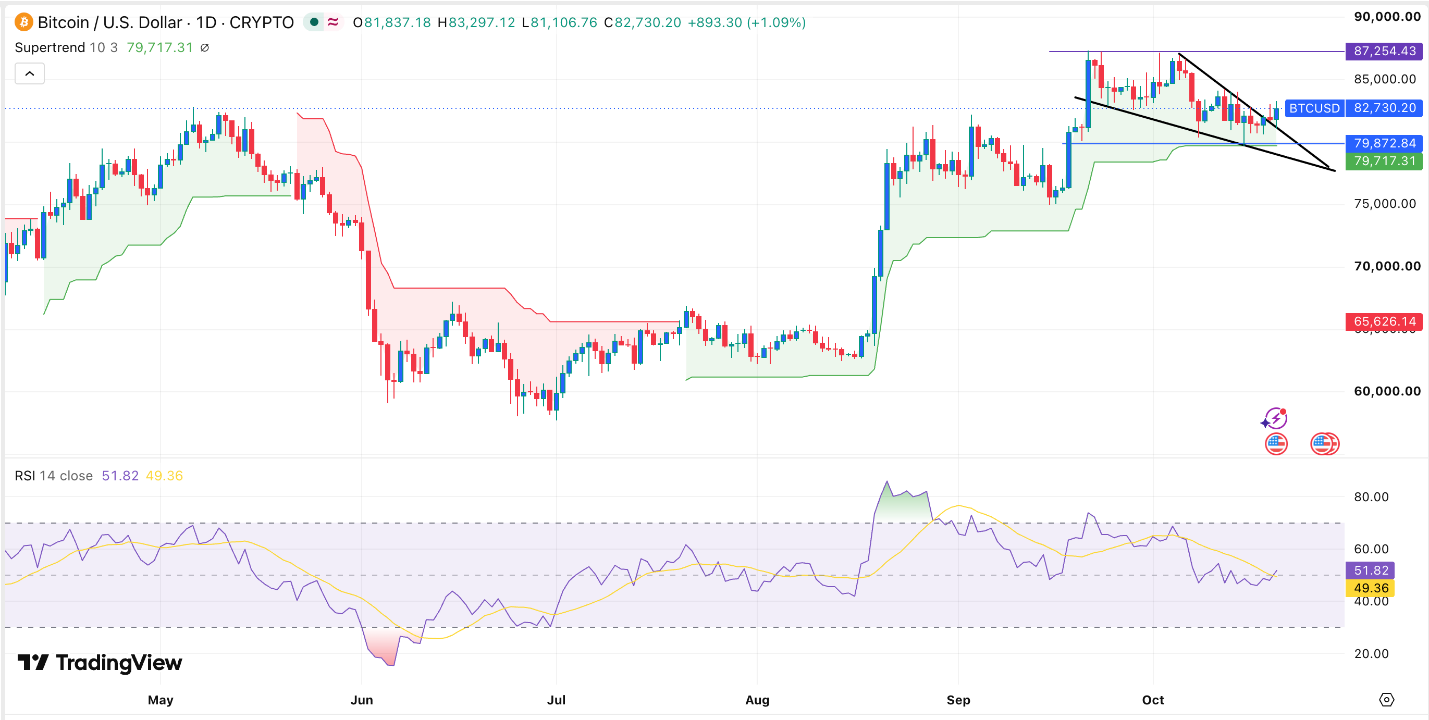
Bitcoin price held steady above $82,000 on Wednesday morning as investors embraced a risk-on sentiment on hopes that the US and Iran will reach an agreement. BTC/USD jumped to 82,655, up modestly from this month’s low of 79,870.
Top Regulated Brokers
Bitcoin Jumps on Risk-On Sentiment
BTC/USD pair rose as traders embraced a risk-on sentiment during the American and Asian sessions. US stocks jumped, with the Dow Jones rising by 512 points and the Nasdaq 100 spiking by 60 points. At the same time, US bond yields continued falling, with the ten-year falling to 5.127%.
This price action coincided with the decline in oil prices. After soaring to $111 on Tuesday, Brent dropped to $108, while the West Texas Intermediate (WTI) fell to $98. Investors are hoping that the US and Iran will strike a deal to end hostilities. This, however, seems highly unlikely as Iran has continued to shoot tankers attempting to cross the Strait. IRGC hopes that this will push oil prices higher and affect the midterm elections.
The risk-on sentiment is evident in the ETF market, where inflows have jumped by over $800 million this year. Most of these gains have been led by BlackRock’s IBIT, which now has over $66 billion in assets under management.
BTC/USD also rose as top Bitcoin buyers continued accumulating. Strategy bought more coins last week, and now has 848,517 coins. Strive also continued buying and now holds 36,818 coins. It also closed the IPO of SATS, which gave it enough cash to buy 7,328 coins, which are now valued at over $600 million.
BTC/USD Technical Analysis Points to More Gains
The daily chart shows that the BTC/USD pair has crawled back in the past few days, moving from 79,870 on October 15 to the current 82,725.
On the positive side, Bitcoin has remained above the Supertrend indicator since July 21 this year. It has also formed a falling wedge pattern, a common bullish reversal pattern.
Bitcoin has held steady above the 50-day Exponential Moving Average (EMA), while the Relative Strength Index (RSI) has reversed and moved above 50. Therefore, the most likely scenario is where the pair rebounds and retests the key resistance level of 87,254. A move above that level will point to more gains, potentially to 90,000.
Ready to trade our daily Forex signals? Here’s a list of some of the best crypto brokers to check out.