


Crypto is within a consolidation phase, but this consolidation has become less bullish, after Bitcoin has continued to fail to follow through on its recent significant bullish breakout to new multi-month highs. However, the price has started moving higher again, so maybe that breakout is still in play. Bitcoin tends to behave very technically and to respect obvious technical analysis features, so let’s see what the chart is saying.
Top Regulated Brokers
BTC/USD Technical Analysis
The daily chart shows a continuing consolidation below a key resistance level at $87,293, with a recent sharp move lower that broke a previous floor at about $83,340. This strong move lower almost reached $80,000 but made a strong bullish bounce at the slightly higher support level of $81,630. The price has continued to trade higher since this happened and has now regained the former support level at $83,340, trading above it. These are bullish signs that the bullish consolidation has survived an important test.
Drilling down to the hourly price chart, we can see that this new and very pivotal point can be revised slightly higher, to $83,440. Above that, there are two resistance levels clustered closely together just below the round number at $85,000 so we can see that as another line in the sand. Bulls will have to overcome $85,000 before being able to face the long-term high and extremely important resistance level at $87,293.
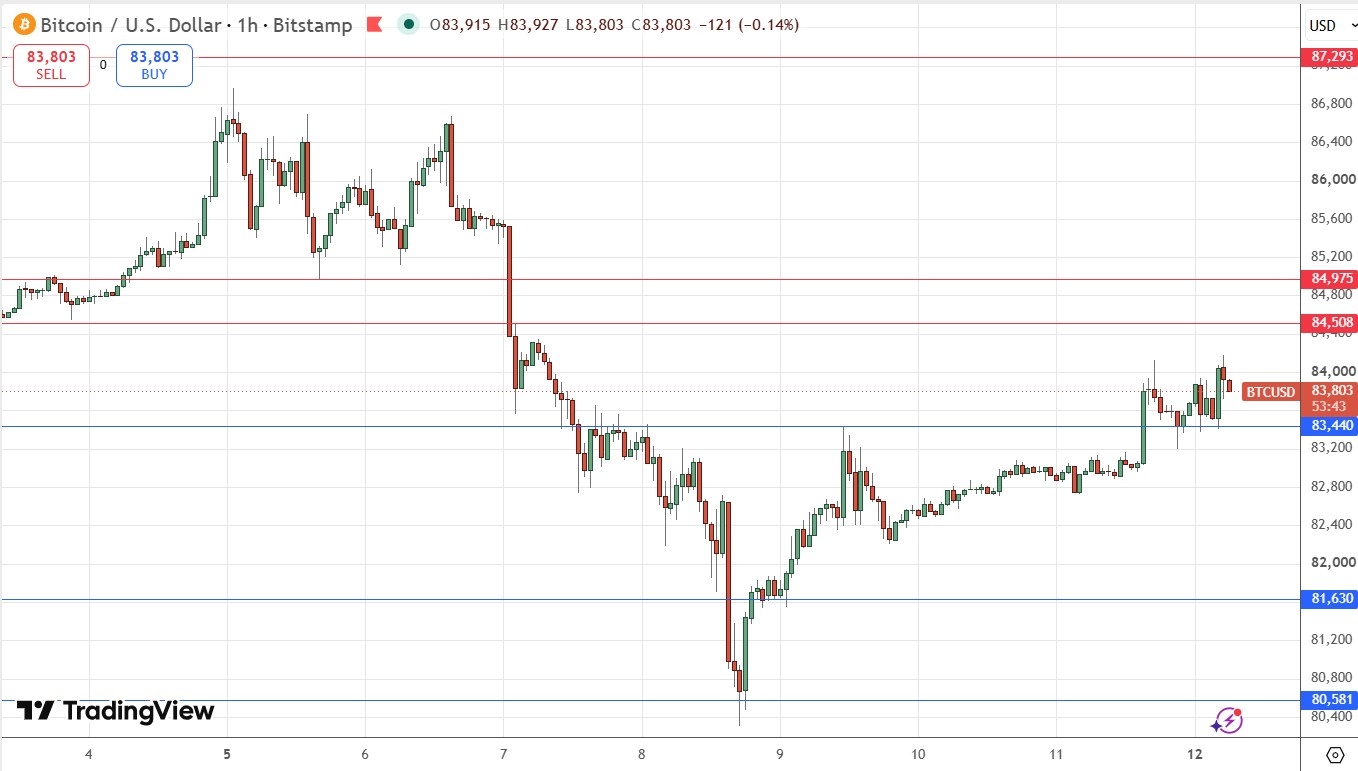
Bitcoin Price Chart – $83,440 Pivotal Support
My Take on BTC/USD
I am already long of Bitcoin as a trend trader, and I use a volatility-based trailing stop, but I think a daily close below $80,000 would be a good signal for anyone to get out of a long position if they are only in it for the relatively short term.
I think a daily close above $87,293, especially if near the top of the day’s range within an unusually large daily candlestick, will be an exciting signal to either enter a new long trade, or add to a long position if already long.
If you are day or swing trading, you might want to try to anticipate an eventual long-term bullish breakout by entering long after the price gets established above $85,000 as long as the short-term reward to risk makes sense, which would have to mean that the price at entry was still quite close to $85,000.
I am not interested in taking a short trade in Bitcoin above $80,000.
Review, Support & Resistance Levels
My previous BTC/USD signal on 7th October produced a profitable long trade from the bullish bounce at $80,581.
Today’s BTC/USD Signals
Risk 0.50% per trade.
Trades may be taken before 5pm Tokyo time Tuesday.
Long Trade Ideas
Go long after a bullish price action reversal on the H1 timeframe following the next touch of $83,440, $81,630, or $80,581.
Place the stop loss $100 below the local swing low.
Move the stop loss to break even once the trade is $100 in profit by price.
Take off 50% of the position as profit when the trade is $100 in profit by price and leave the remainder of the position to ride.
Short Trade Ideas
Go short after a bullish price action reversal on the H1 timeframe following the next touch of $84,508, $84,975, or $87,293.
Place the stop loss $100 above the local swing high.
Adjust the stop loss to break even once the trade is $100 in profit by price.
Take off 50% of the position as profit when the trade is $100 in profit by price and leave the remainder of the position to ride.
The best method to identify a classic “price action reversal” is for an hourly candle to close, such as a pin bar, a doji, an outside or even just an engulfing candle with a higher close. You can exploit these levels or zones by watching the price action that occurs at the given levels.
There is nothing of high importance scheduled today concerning either Bitcoin or the US Dollar.
Ready to trade our free crypto signals? Here is our list of the best MT4 crypto brokers in the world worth checking out.