


Crypto has enjoyed a comeback in recent weeks, with Bitcoin finally making a significant bullish breakout to new multi-month highs, and for a while it looked like we might see it really take off to the upside. However, momentum has faltered, and it seems to be following the same pattern as the US stock market – kind of holding up, but without giving any strong indication that it is going to go anywhere that will excite investors and traders. Is there still hope for bulls, or was it just a flash in the pan?
Top Regulated Brokers
BTC/USD Technical Analysis
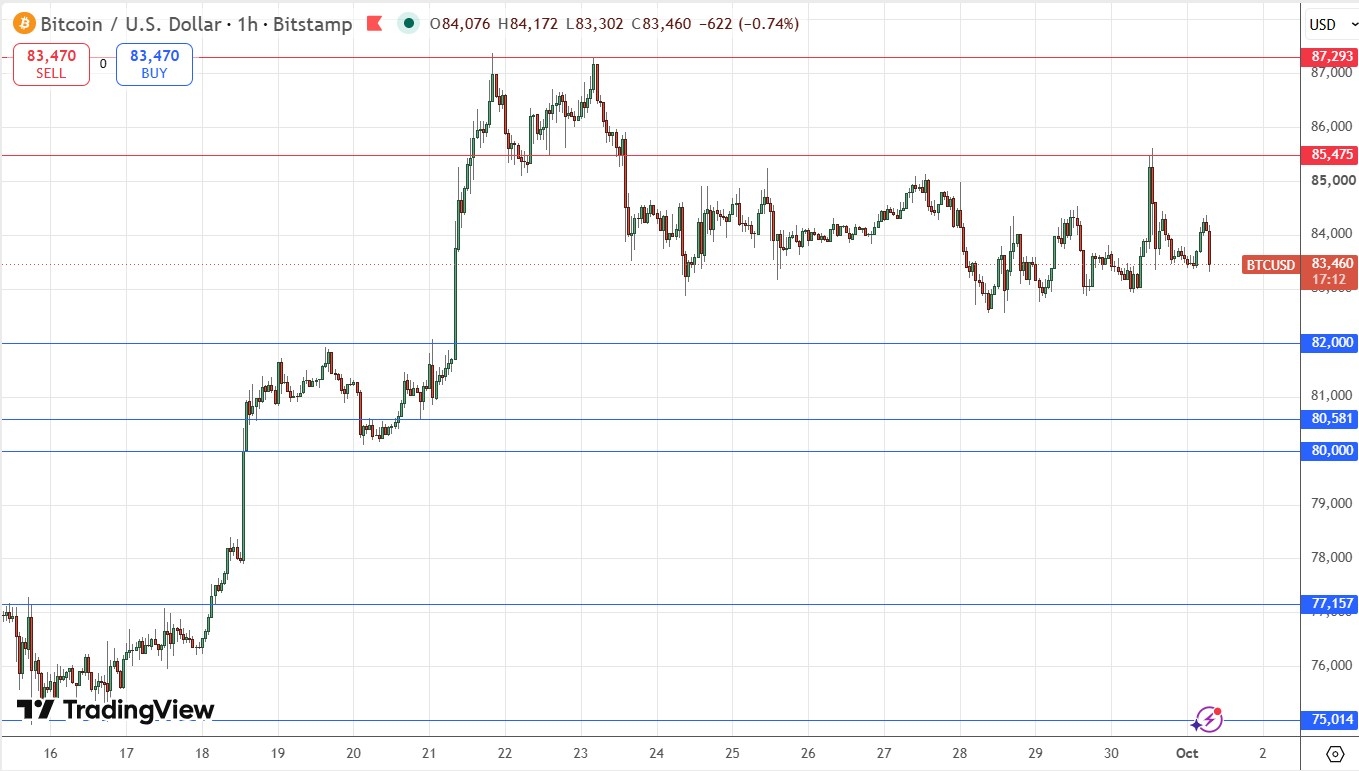
The price made a bearish double top just above $87,000, which was a long term high, and then fell to begin a consolidation pattern between $82,500 and $85,500 which is still ongoing. Obvious lines in the sand below the recent price action which have become “lines in the sand” likely to affect sentiment are $82,000 and of course the big round number at $80,000. If Bitcoin gets established below either of these levels, bulls will be in serious trouble, although short-term dips below there could run into demand and bounce straight back up.
I am long of Bitcoin as a trend trader, and I use a volatility-based stop, but I think a daily close below $80,000 would be a good signal for anyone to get out of a long position if they are only in it for the relatively short term. However, the support levels above that which I have marked in the price chart below could be good buying points if they hold up.
Having said that, the resistance level above at $85,475 does look strong, so a short-term short trade from another strong rejection there could be a good play.
My Take on BTC/USD
There is still hope for bulls and I see the best approach for traders here as to still look to the long side, as long as the price remains above $80,000. The best approach will probably be to buy bounces from the support levels at $80,000 or above. A short from another rejection of $85,475 could be a good short-term trade if it sets up.
Review, Support & Resistance Levels
Today’s BTC/USD Signals
Risk 0.50% per trade.
Trades may only be entered by 5pm Tokyo time Friday.
Long Trade Ideas
Go long after a bullish price action reversal on the H1 timeframe following the next touch of $82,000, $80,581, or $80,000.
Place the stop loss $100 below the local swing low.
Move the stop loss to break even once the trade is $100 in profit by price.
Take off 50% of the position as profit when the trade is $100 in profit by price and leave the remainder of the position to ride.
Short Trade Ideas
Go short after a bullish price action reversal on the H1 timeframe following the next touch of $85,475 or $87,293.
Place the stop loss $100 above the local swing high.
Adjust the stop loss to break even once the trade is $100 in profit by price.
Take off 50% of the position as profit when the trade is $100 in profit by price and leave the remainder of the position to ride.
The best method to identify a classic “price action reversal” is for an hourly candle to close, such as a pin bar, a doji, an outside or even just an engulfing candle with a higher close. You can exploit these levels or zones by watching the price action that occurs at the given levels.
There is nothing of high importance scheduled today concerning Bitcoin or the US Dollar.
Ready to trade our free crypto signals? Here is our list of the best MT4 crypto brokers in the world worth checking out.