


King Crypto is testing the resilience of its recovery as accumulation activity, exchange-traded fund (ETF) flows, investor sentiment and derivatives positioning shape the outlook for its next move. After rebounding sharply from its summer lows, BTC/USD is consolidating above $80,000, with buyers aggressively defending support while market participants search for a catalyst to resume its uptrend.
Top Regulated Brokers
Several market indicators offer reasons to watch for further upside for the pioneer cryptocurrency. Bitcoin’s technical setup also supports the upside as the daily chart presents a potential bullish continuation pattern, with targets between $95,000 and $100,000. Whether BTC reaches these levels will depend on its ability to clear resistance and turn improving demand into sustained buying pressure.
Bitcoin Accumulation Wallets Offer a Bullish Signal for BTC
Bitcoin’s accumulation behavior is one of the first indicators to watch when assessing whether its recovery has further room to run.
Ochain data provider Santiment highlights activity increasing among accumulation wallets, a category of addresses associated with investors steadily adding BTC rather than frequently trading their holdings.
The chart below shows that 14,942 BTC, worth $1.2 billion at current rates, left exchanges on net on Oct. 26, the network’s largest outflow day in five weeks.
The move comes immediately before the Fed decision later today and major GDP and PCE data tomorrow.
“The encouraging part is where traders are positioning their coins,” Santiment said, adding:
“Instead of sending $BTC onto exchanges ahead of potentially bad news, holders are moving supply away from immediate selling venues, suggesting less defensive positioning than the macro uncertainty might imply.”
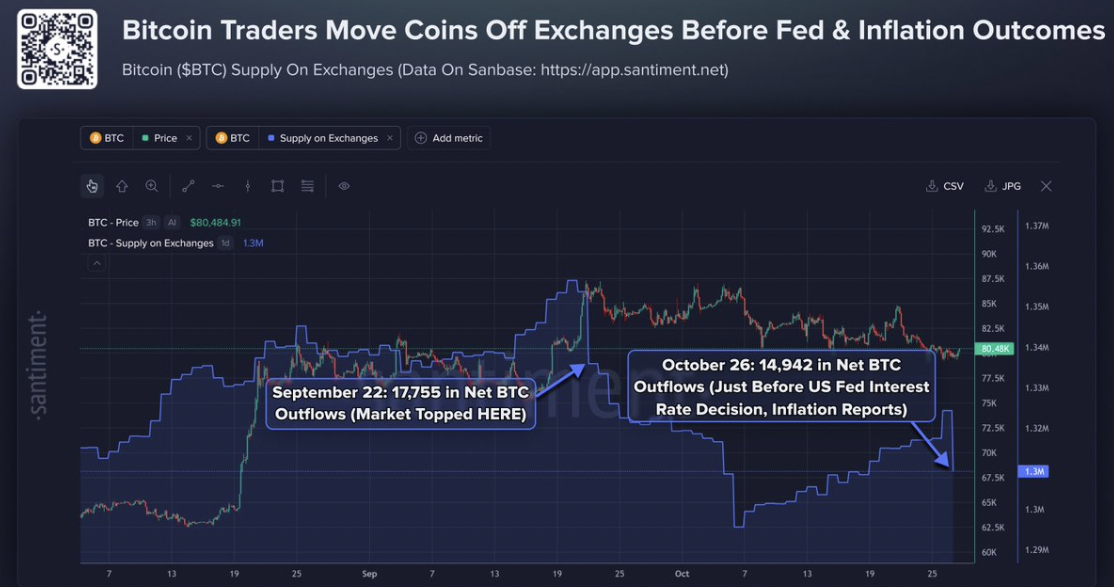
Bitcoin supply on exchanges. Source: Santiment
$80,000 is the first level to defend through the volatility that is expected over the next couple of days. Holding it while exchange supply keeps falling would favor a rebound toward $82,500 to $84,00.
“A decisive loss of roughly $79K would weaken the bullish setup, while an $82.5K reclaim after the macro releases would provide much stronger confirmation,” the onchain data provider added.
Accumulation can support a bullish outlook because coins moving into long-term holding addresses may become less readily available for sale. If demand remains stable or increases while liquid supply tightens, the market may find it easier to absorb selling pressure and advance.
Bitcoin ETF Inflows Could Give BTC’s Recovery Fresh Momentum
Spot Bitcoin ETF flows provide another measure of demand because they track net capital entering or leaving regulated investment products. Persistent inflows can support Bitcoin by creating additional demand for exposure to the underlying asset, while sustained outflows may weaken the recovery.
These investment products have returned to positive flows, with the last two weeks recording net inflows as shown in the chart below. Data from SoSoValue shows that Bitcoin ETFs have $591 million in net inflows over the last seven days.
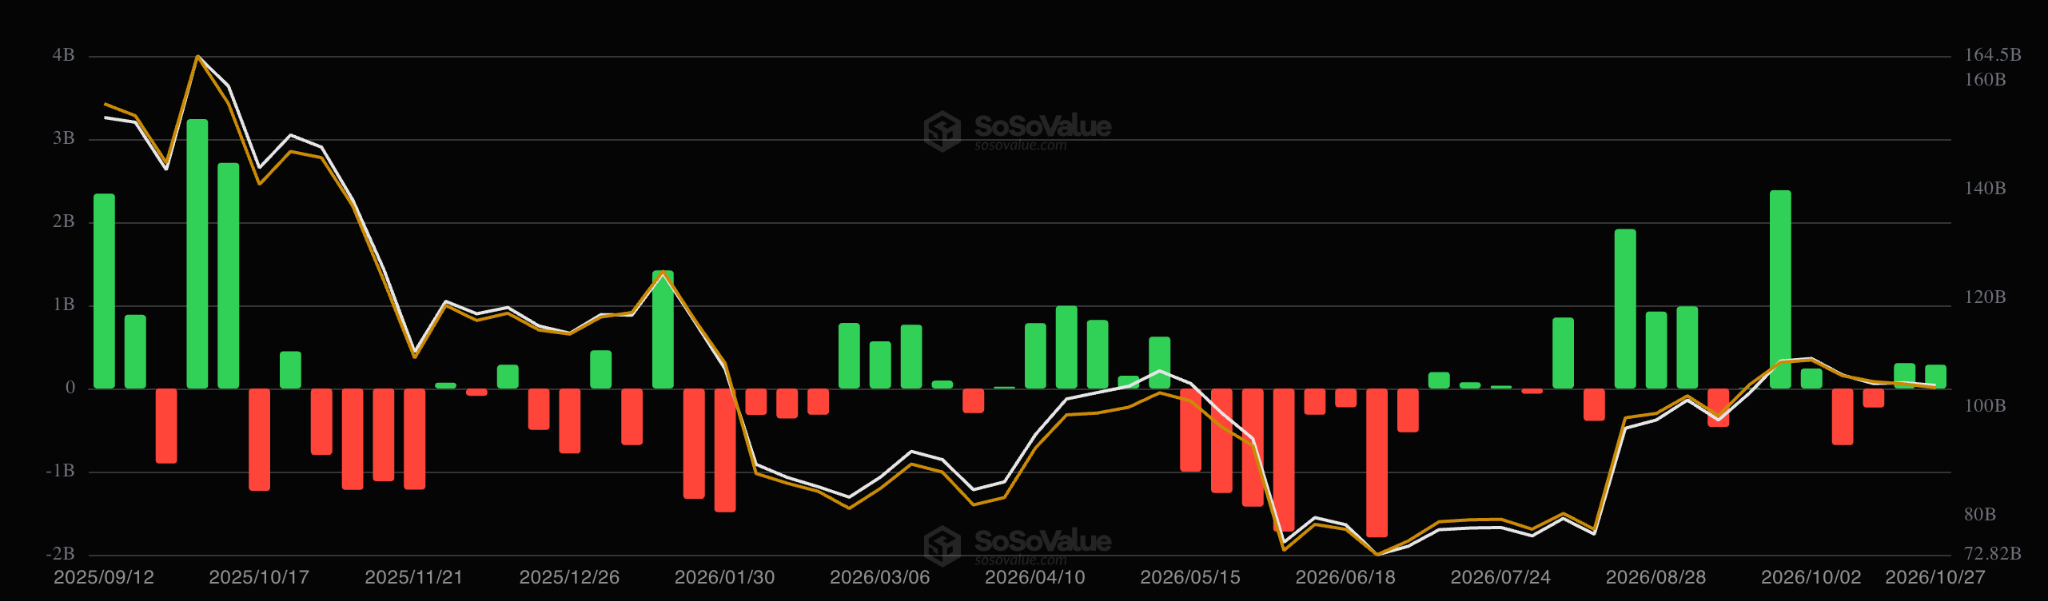
Spot Bitcoin ETF flows chart. Source: SoSoValue
“The weekly spot Bitcoin ETF netflow reflects moderate institutional capital inflows, signaling that the traditional finance demand remains positive,” Glassnode in its latest Weekly Market Pulse report.
These cases support the idea that if capital continues to flow into spot Bitcoin ETFs, it will result in its price rallying back above $100,000.
Investor sentiment remains positive
Investor sentiment provides a useful gauge of whether the market is becoming more confident in Bitcoin’s recovery or increasingly cautious about further losses. The Crypto Fear and Greed Index combines indicators including volatility, momentum, trading volume, social activity and Bitcoin dominance to assess market psychology.
The latest reading from Alternative.me stood at 51, classified as neutral, on Oct. 28. That compares with 63, or greed, one week earlier and 74 one month earlier.
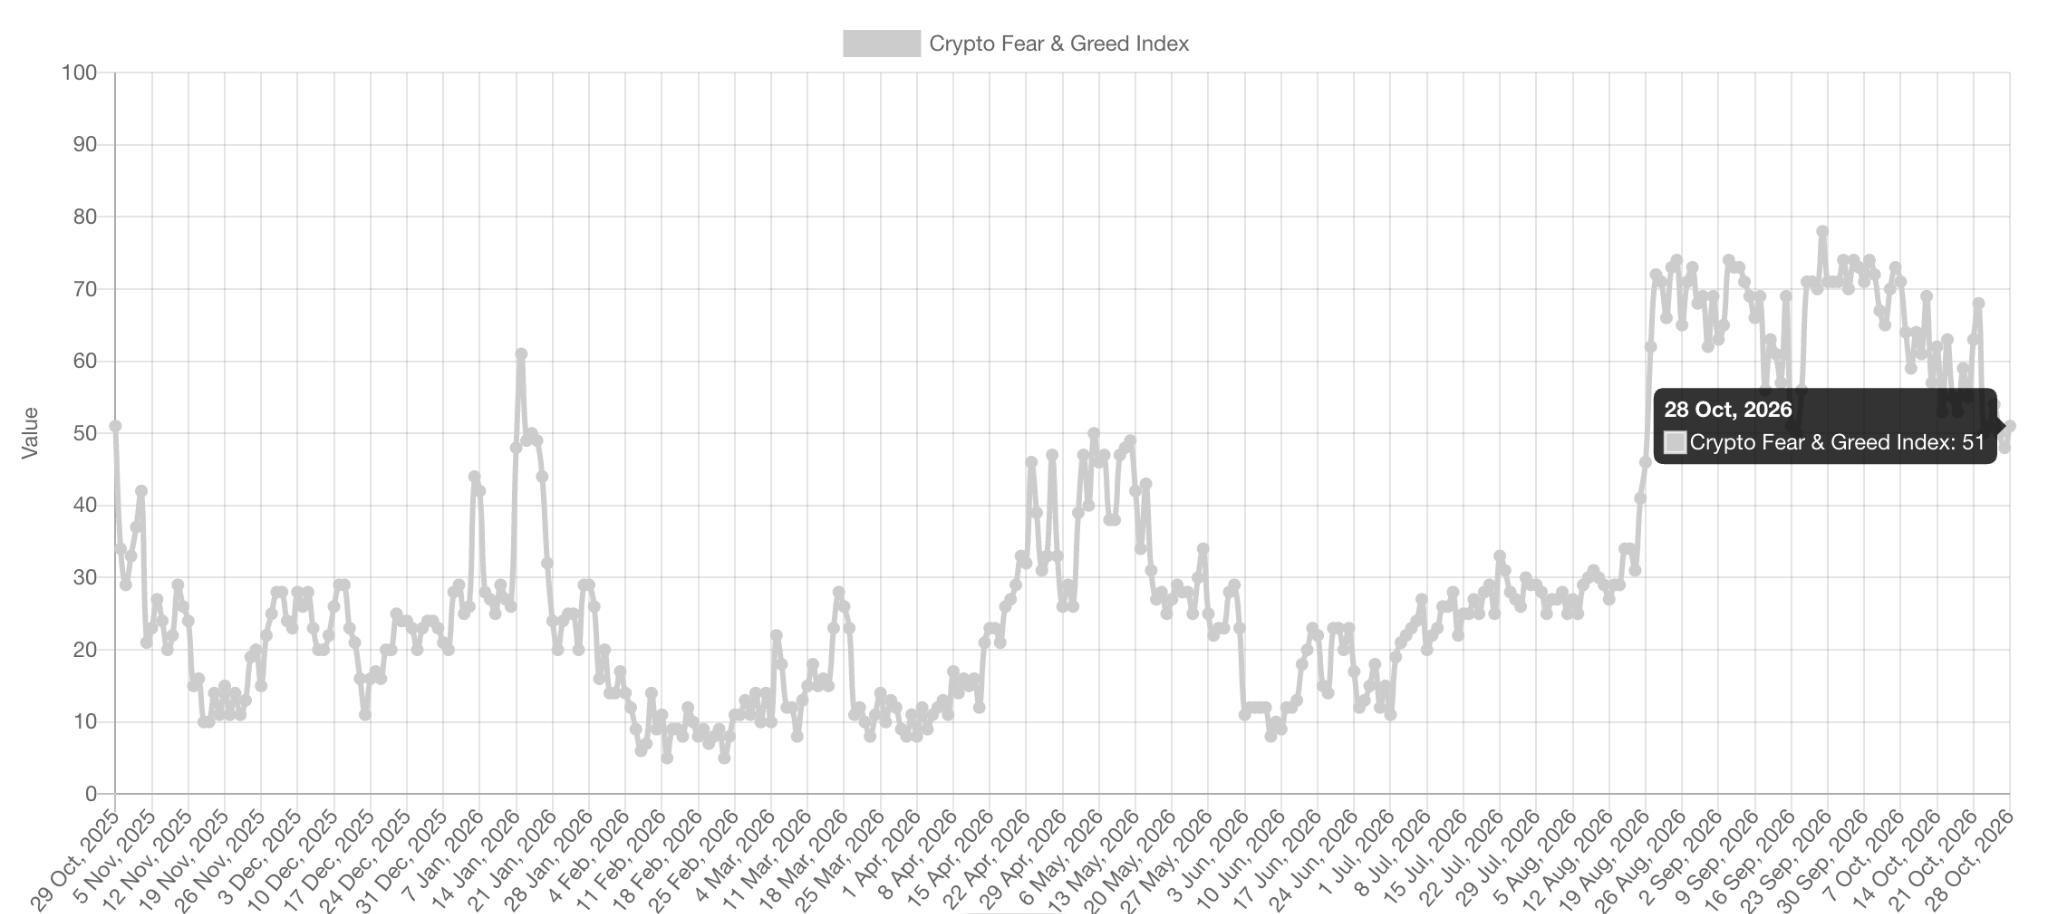
Crypto Fear and Greed Index. Source: Alternative.me
Notably, this index remains above the 50 mark, after dipping below it yesterday. Sustaining this index in the “greed” zone since August is a strong indication of the positive sentiment the market players have for the wider crypto market.
This pattern in market sentiment has been a precursor to price rallies in the past and could be an indicator of an upcoming bull run. Interestingly, the index is close to the levels seen in October, 2025 and January, 2025, accompanying 22% and 40% price rallies, respectively.
This suggests that the Crypto Fear and Green Index could still rise into the “extreme greed” zone beyond 85, possibly ushering in the next Bitcoin bull cycle.
Bitcoin Open Interest Jumps 10% as Traders Rebuild Positions
Bitcoin’s derivatives market is providing another clue about the strength of the current recovery. Open interest (OI), which measures the outstanding value of unsettled futures and perpetual-futures contracts, is an important indicator of how much capital is committed to leveraged positions.
This metric has increased substantially throughout October, expanding by more than 10% from 619,000 BTC on October 7 to 676,000 BTC at the time of writing, according to CoinGlass data. This suggests that traders may be positioning for a breakout, anticipating renewed volatility or taking advantage of price movements around key technical levels.
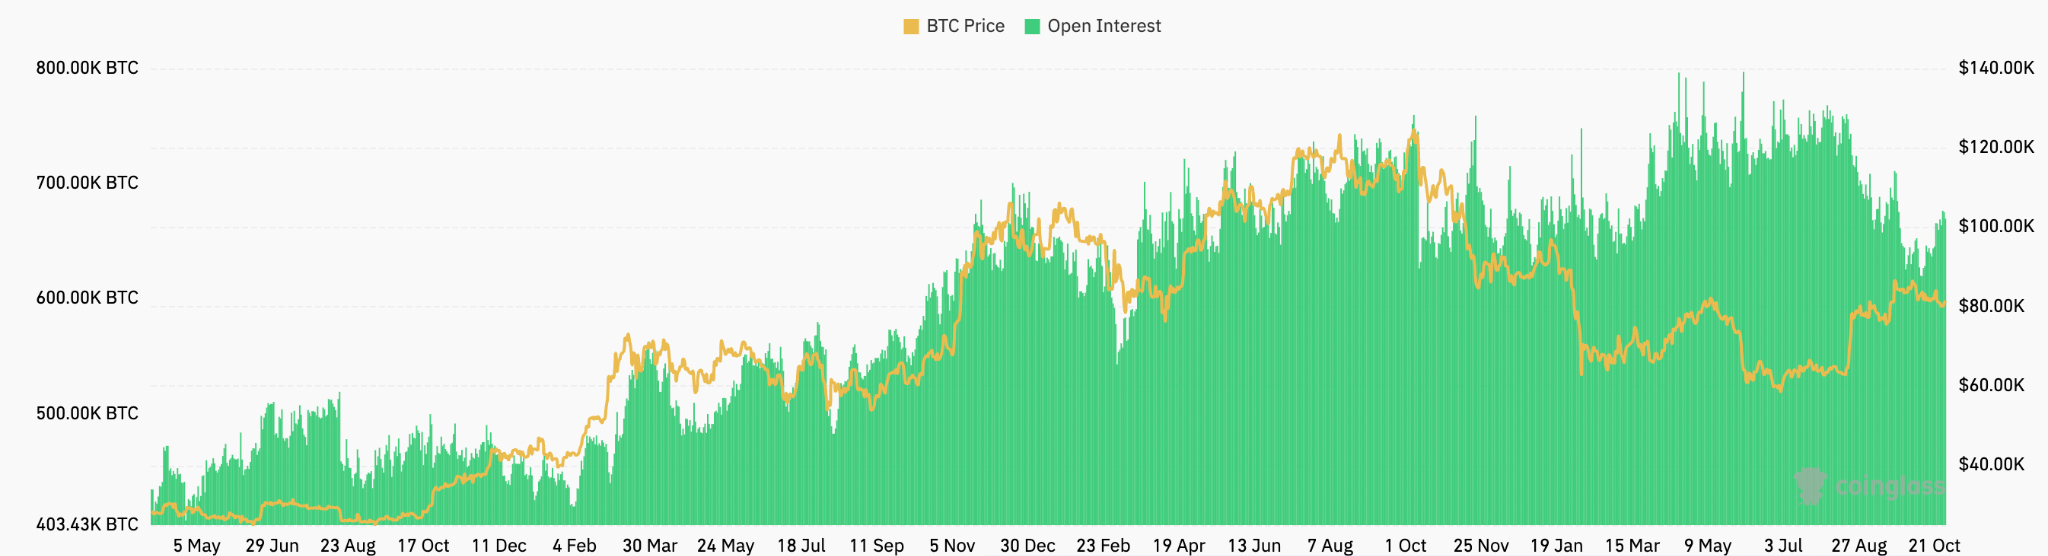
Bitcoin futures aggregate open interest, BTC. Source: CoinGlass
Historically, when the OI remains high for an extended period, markets tend to enter a euphoric phase. With Bitcoin price still hovering around all-time highs, investor interest continues to build in the derivatives market, positively impacting the price.
If Bitcoin rises while OI increases at a measured pace, the combination could indicate that traders are adding exposure as momentum improves. A breakout above resistance supported by spot demand would strengthen that interpretation.
Bitcoin Bull Pennants Point to Potential Targets Near $100,000
Zooming out to the macro canvas, Bitcoin's chart is a textbook bullish setup, with the daily time frame revealing two bull pennants projecting higher targets for Bitcoin.
The first is a larger bull flag that formed between August 15 and September 18, as shown in the chart below. The flag is still in play at the time of writing and has a measured target of $100,800. The second bull flag formed between Sept. 18 and today, with a measure target of $95,000.
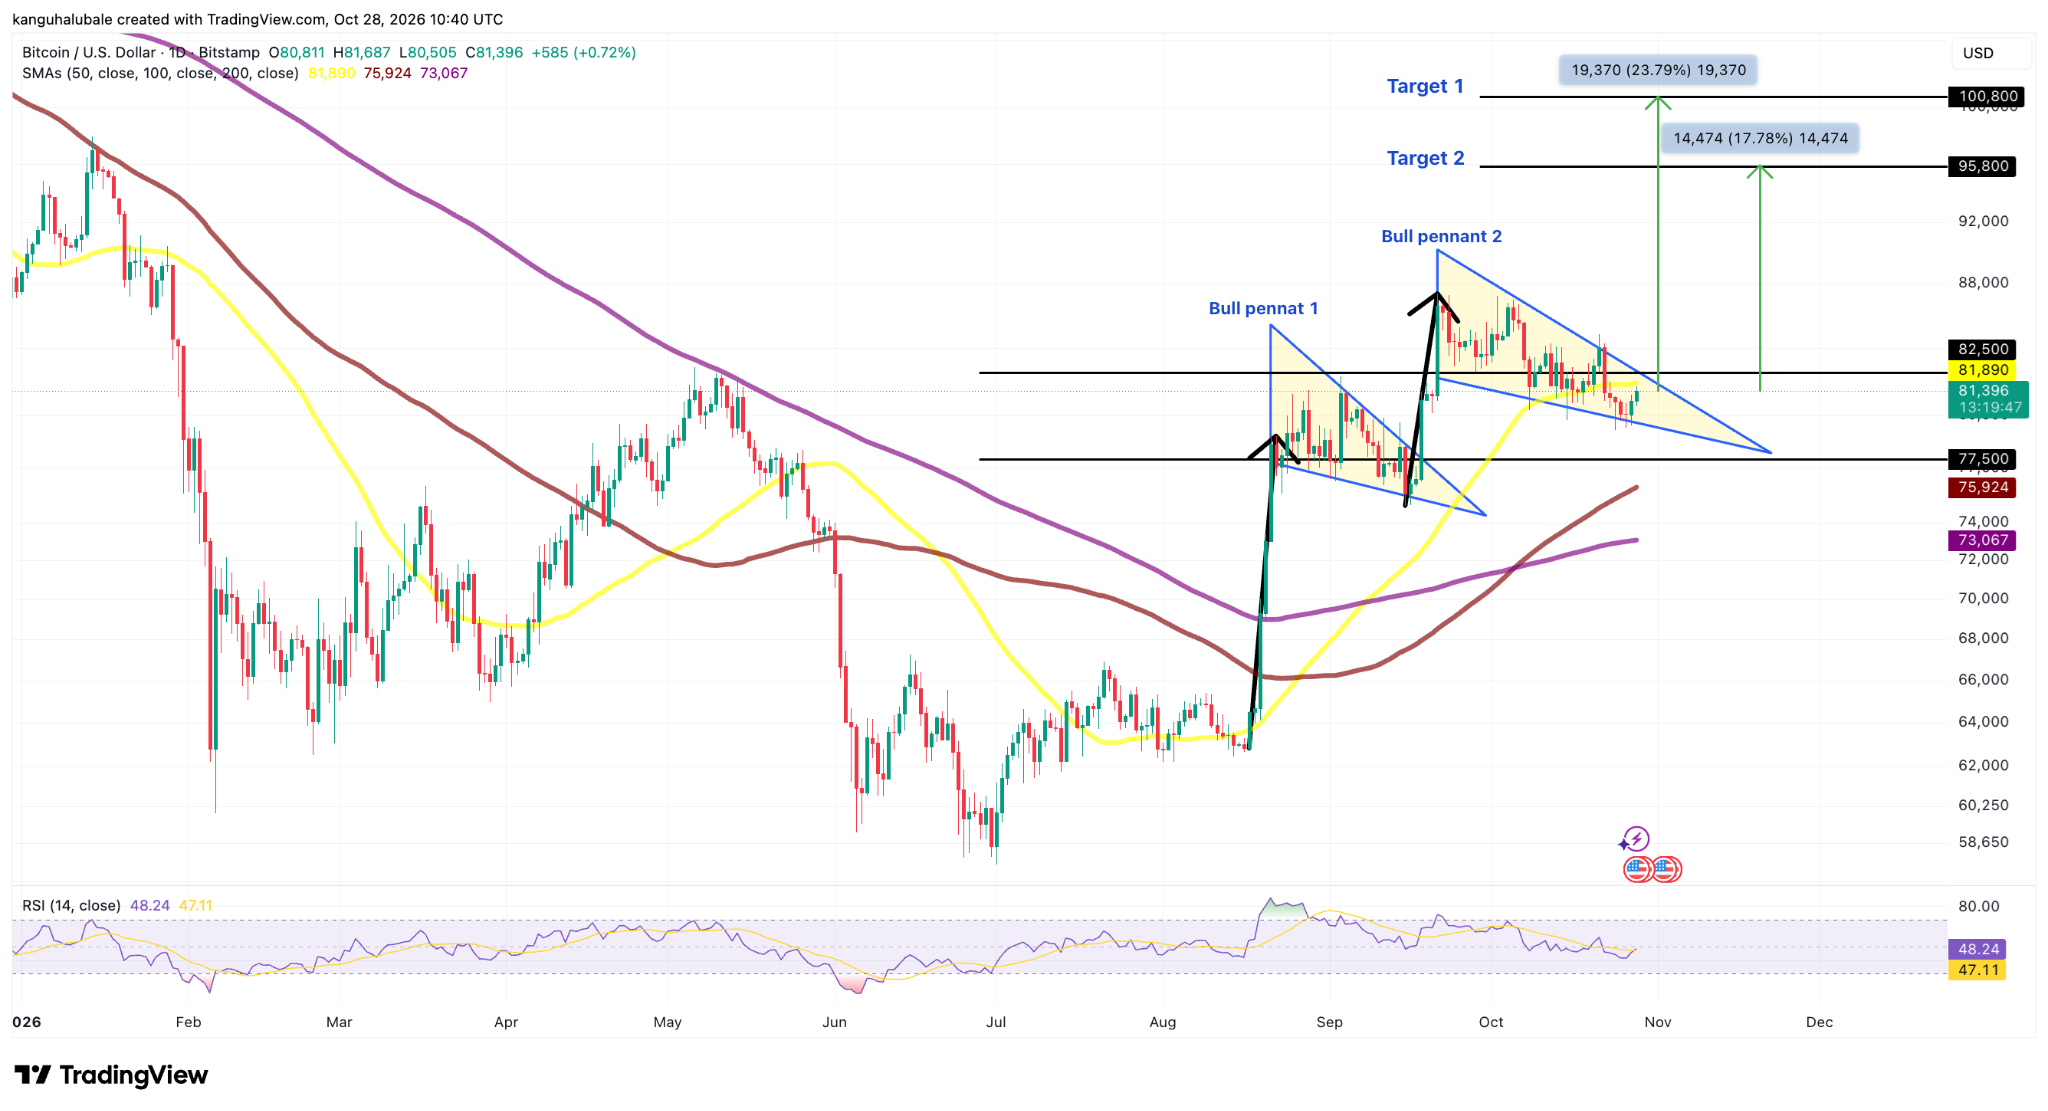
BTC/USD daily chart. Source: TradingView
However, bulls should hold firm support at the $77,500-$80,000 range, which bulls must defend to secure the upside.
The chart above also shows a resistance around $82,500. Bitcoin is also trading below its 50-day simple moving average (SMA), around $81,900, while remaining above the 100-day SMA near $76,000 and the 200-day SMA near $73,000.
The 50-day SMA is therefore the immediate hurdle. A sustained move above $82,500 would strengthen the bullish case, while a break below $77,500 could undermine the pennant structure and expose lower support.
Conversely, the daily relative strength index (RSI) is near 47.9, below the neutral 50 threshold, suggesting that the bullish momentum has moderated during consolidation rather than established a strong new upward impulse.
Can Bitcoin Sustain Its Recovery Toward $100,000?
Bitcoin’s positive outlook rests on several indicators aligning rather than any single bullish signal. Exchange outflows, a recovery in ETF inflows and a confirmed breakout above $82,500 would strengthen the prospect of a move toward $95,800 and potentially back into six figures.
However, neutral sentiment and rising open interest also highlight the risks. If leverage increases without stronger spot demand, a failed breakout could trigger liquidations and renewed selling pressure. The $77,500 level remains an important support reference on the supplied chart.
In my overall opinion, Bitcoin’s outlook is cautiously bullish, provided buyers reclaim resistance and sustain demand. The technical targets remain conditional, and the next decisive move will depend on whether accumulation and institutional flows translate into stronger spot-market buying.
Ready to trade our analysis of Bitcoin? Here’s our list of the best MT4 crypto brokers worth reviewing.