


The crypto sector is sinking, and continues to look bearish, and Bitcoin looks likely to go down with it. Now that the price has started moving lower again, the big breakout to significant technical lows below $80,000 is back in play. Bitcoin tends to behave very technically and to respect obvious technical analysis features, so let’s see what the chart is saying.
Top Regulated Brokers
BTC/USD Technical Analysis
The daily chart shows that the price – just as can be seen in Gold – is currently contained within a descending price channel, which has been in force for over a month. While it is true that not all the price action was cleanly contained within the linear regression analysis study which can be imposed on this, it is a convincing channel.
This downwards movement tested the $80,000 level which has clearly become an important line in the sand for Bitcoin, and the support initially seemed to hold – but it is now being tested again, and the price is again dipping below $80,000, although not convincingly.
The momentum is bearish, and the fact that this level is being tested again so quickly after it held earlier this week is a bearish sign. However, we do not have a decisive breakdown yet.
Drilling down to the hourly chart, we can see new bearish signs, with new lower resistance levels. There is one near $82,000 but the more exciting one is at $80,321. Watch carefully to see if this level holds for clues as to the next likely major price movement.
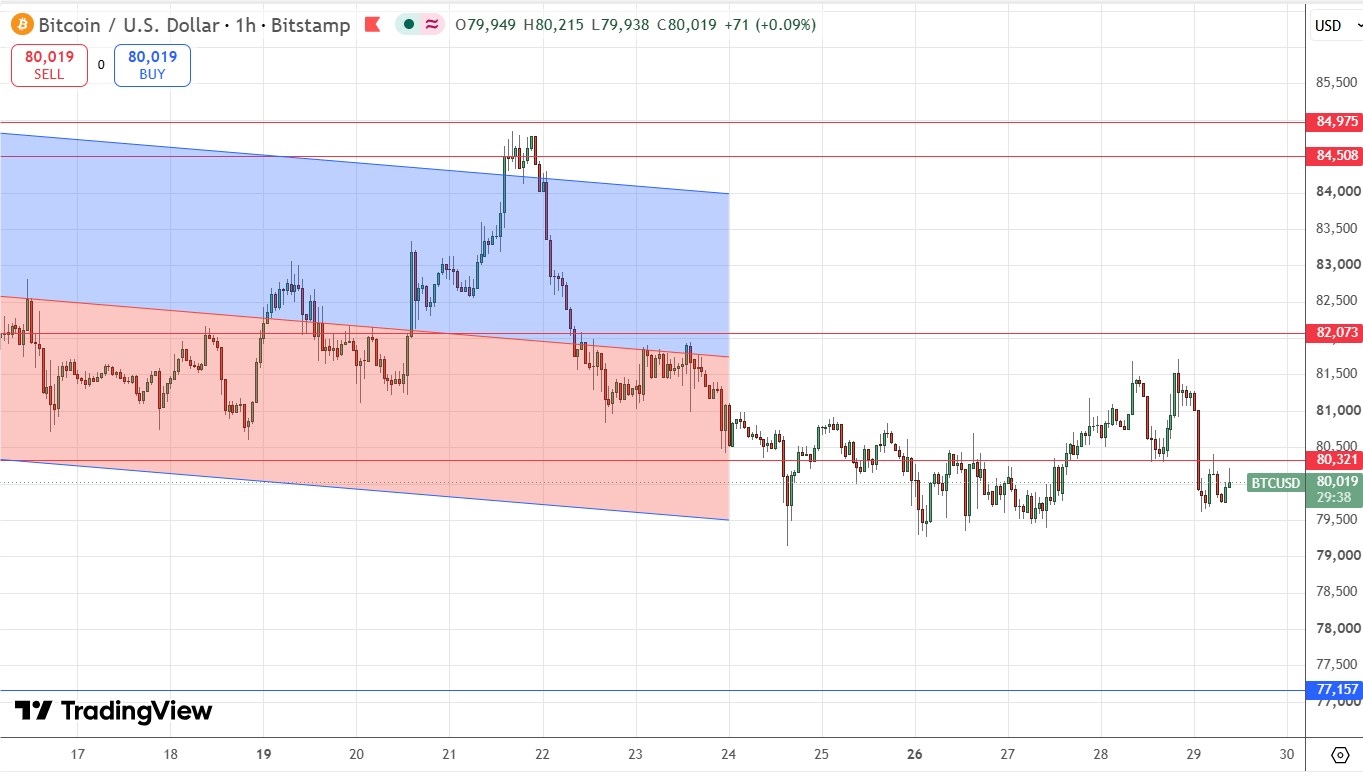
Bitcoin Price Chart – Testing $80,000 Again
My Take on BTC/USD
A daily close below $80,000 with the resistance at $80,321 holding will be a very bearish sign of an impending major breakdown. If the price closes below the recent swing low at $79,146 that will be quite a decisive bearish sign.
I have exited my long trade in Bitcoin.
Review, Support & Resistance Levels
My previous BTC/USD signal on 19th October gave a profitable short trade from the rejection of the resistance level at $82,875.
Today’s BTC/USD Signals
Risk 0.50% per trade.
Trades may be taken before 5pm Tokyo time Friday.
Long Trade Idea
Go long after a bullish price action reversal on the H1 timeframe following the next touch of $77,157.
Place the stop loss $100 below the local swing low.
Move the stop loss to break even once the trade is $100 in profit by price.
Take off 50% of the position as profit when the trade is $100 in profit by price and leave the remainder of the position to ride.
Short Trade Ideas
Go short after a bullish price action reversal on the H1 timeframe following the next touch of $80,321, $82,073, or $84,508.
Place the stop loss $100 above the local swing high.
Adjust the stop loss to break even once the trade is $100 in profit by price.
Take off 50% of the position as profit when the trade is $100 in profit by price and leave the remainder of the position to ride.
The best method to identify a classic “price action reversal” is for an hourly candle to close, such as a pin bar, a doji, an outside or even just an engulfing candle with a higher close. You can exploit these levels or zones by watching the price action that occurs at the given levels.
There is nothing of high importance scheduled today concerning Bitcoin. Regarding the US Dollar there will be releases of Advance GDP and Core PCE Price Index data at 12:30pm London time.
Ready to trade our free crypto signals? Here is our list of the best MT4 crypto brokers worth reviewing.