


Top Regulated Brokers
King Crypto enters Wednesday with its shorter daily trend under pressure. BTC/USD has extended its retreat from the latest high, fallen below its 20-day average and lost ground alongside most of the wider crypto market. Buyers now face a test of whether the move is a temporary break or a more persistent loss of momentum.
The Federal Reserve is about to publish a fuller account of its latest policy discussion, giving bond, currency and crypto markets new material to interpret. Bitcoin approaches that event with a complication: its price has weakened despite a return to net inflows into U.S. spot Bitcoin ETFs. Whether buyers can recover the lost ground matters more than the first reaction to the release.
Bitcoin Trades Below Its 20-Day Average
The Federal Reserve's official calendar schedules minutes from the September 15-16 Federal Open Market Committee meeting for Wednesday at 2:00 p.m. Eastern time. They can reveal more detail about how policymakers weighed inflation, growth and the path of interest rates, though they do not predetermine the next decision.
For Bitcoin, the relevance runs through the broader financial conditions around it. A change in rate expectations can move Treasury yields and the dollar, alter the relative appeal of assets that produce no cash flow and shift appetite for risk. Those channels are neither automatic nor consistently directional. BTC can respond before the release, after it or barely at all.
Farside Investors showed an $89.8 million net outflow from U.S. spot Bitcoin ETFs on Monday, October 5, followed by a $118.8 million net inflow on Tuesday, October 6. Together, those sessions produced a $29 million net inflow. In both cases, Bitcoin declined across the completed sessions and extended its retreat afterward. The divergence shows why a positive fund-flow total cannot, by itself, establish that the wider market has enough demand to defend a price level. The ETF channel captures one part of the market rather than every source of buying and selling.
Broad Crypto Weakness Adds Pressure on Bitcoin
Data provided by TradingView placed BTC/USD at $82,975 at the time of writing, down 0.85% on the week, while the pair traded below the 20-day simple moving average at $84,165 and above the 50-day average at $80,270. Price stood about 1% below the shorter average and 3.75% above the longer one.
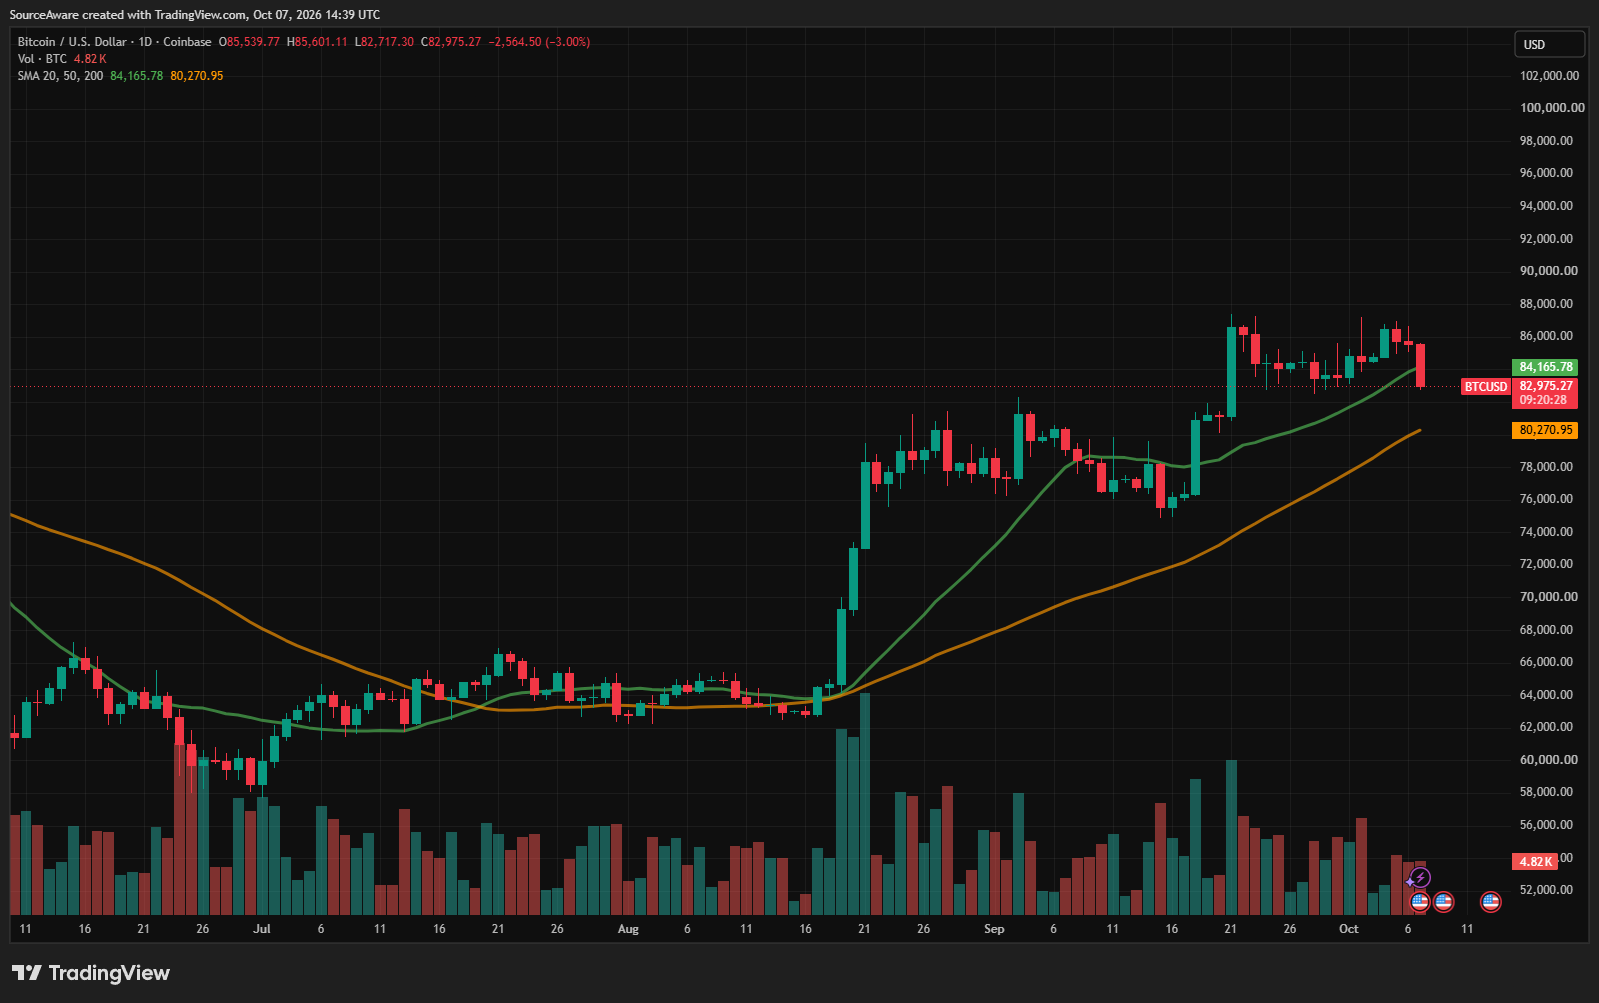
BTC/USD 1-day chart. Source: TradingView
Early Wednesday trading deepened the retreat below the 20-day average, leaving BTC about 2.50% beneath Tuesday's close at the time of writing. Coinbase's completed UTC candles show BTC closing at $85,540 on Tuesday after opening the two-session weekday window at $86,503 on Monday. The resulting decline across the two completed sessions was 1.11%. Monday traded as high as $86,996 before closing at $85,749, while Tuesday reached $86,698 and closed at $85,540. Both sessions tested higher ground and gave back the attempt, leaving a series of closes below their respective daily opens.
The October 2 high at $87,249 remains the recent weekly resistance ceiling. Reclaiming the 20-day simple moving average on a closing basis is the more immediate task before the weekly high becomes relevant.
A daily close below the average would strengthen the short-term deterioration case; the intraday breach alone does not settle it. The September 30 low at $82,912 is the next nearby price reference below Wednesday’s low. The 50-day average near $80,270 remains farther down, leaving room for short-term weakness without an established break in the broader trend.
CoinMarketCap's snapshot shows the total crypto market capitalization stood near $2.83 trillion, down 3.18% over 24 hours, while Bitcoin dominance was 59.19%, up 0.09 percentage points.
The data also showed 14 of the top 100 assets positive over seven days and 86 negative. That majority-negative breadth places Bitcoin's decline inside a broad pullback rather than an isolated move. BTC's own rolling seven-day return was also negative, while its rising dominance suggests smaller assets were generally absorbing more pressure. The split does not establish how long the weakness will last, but it leaves buyers with little evidence of broad participation behind an immediate rebound.
Why a Quick Bitcoin Rebound Is Not Yet Confirmed
Price finished both completed weekday sessions below the open and failed to hold moves into the upper $86,000s. Wednesday then pushed BTC farther below the 20-day average as seven-day breadth weakened to 14 positive assets against 86 negative. The two-day net ETF inflow makes a simple fund-withdrawal explanation inadequate, but the available figures do not establish a replacement cause.
What is observable is a weaker price position and broad market participation in the decline. A rally that only reaches the average and then fades would leave buyers with more work to do than a sustained recovery above it.
Wednesday's Fed minutes add uncertainty rather than a ready-made catalyst in one direction. A market may focus on language that appears more restrictive, more accommodating or simply dated after newer economic releases. Yields and the dollar can move together or diverge, and Bitcoin's first reaction may reverse before the daily close. The useful test is whether BTC can keep its trend structure once the market has had time to process the document, not whether the first minute after release is green or red.
What Would Strengthen Bitcoin’s Recovery Case
The retreat could still represent a sharp consolidation ahead of a scheduled macro event rather than a structural shift. Bitcoin remains above its 50-day average, and Tuesday's net ETF inflow supplies a counterweight to the weaker chart and breadth.
The current session has not produced a completed daily close below the shorter average, leaving room for buyers to recover the line. Those features keep a recovery scenario credible, though they do not establish that a rebound has begun. A sustained return above the shorter average would provide stronger evidence than a brief touch of the line.
If BTC reclaims the 20-day average on a closing basis, the next task would be rebuilding the range lost during the retreat. Monday's low near $84,944 and Tuesday's near $85,100 mark nearby areas to watch before attention returns to the October 2 high at $87,249. Further net ETF inflows would add evidence of continuing demand through that channel, but price would still need to respond.
Conversely, a daily close below the shorter average followed by another failed recovery would weaken the consolidation case even if fund flows remained positive.
What to Watch After the Fed Minutes Release
Bitcoin reaches the Fed release with its shorter trend under pressure and its broader daily average still below the market. Wednesday's minutes give markets a scheduled point of pressure, but the more useful evidence may come after the initial reaction, as buyers and sellers decide whether the lost range can be recovered.
The 20-day average near $84,165 is the immediate dividing line, with Wednesday's $83,269 low beneath it and the $87,249 weekly high farther above. A recovery that holds would leave a different picture from another rally that fades at the average. The next ETF total and the wider market's participation can help distinguish those possibilities. How much ground can Bitcoin regain before a pause begins to look like a more persistent loss of momentum?
Ready to trade our analysis of Bitcoin? Here’s our list of the best MT4 crypto brokers worth reviewing.