


King Crypto has been consolidating in a tight range over the last two weeks as traders assess whether renewed institutional demand can fuel a recovery toward $90,000. The leading cryptocurrency remains below a significant weekly moving-average resistance level, while liquidation liquidity is building above the current price, creating a potential upside target if the bullish momentum strengthens.
Top Regulated Brokers
At the time of writing on Oct. 21, Bitcoin is trading near $83,450, with its 100-week simple moving average (SMA) at approximately $89,500 and its 50-week SMA near $76,000. Meanwhile, CoinGlass's one-month liquidation heatmap identifies substantial liquidity concentrations above spot price all the way to $90,000.
This combination of technical resistance, leveraged trading positions, and renewed spot Bitcoin exchange-traded fund (ETF) inflows makes $90,000 a critical level to watch. However, whether Bitcoin reaches it will depend on sustained buying pressure and its ability to overcome overhead resistance.
Bitcoin’s 100-Week SMA and the $90K Liquidity Zone
Bitcoin's weekly chart suggests the market is approaching a decisive technical zone, with the 100-week SMA near $89,600 emerging as a major hurdle for bulls. The 50-week SMA, meanwhile, sits around $76,121, providing a potential downside support if the current consolidation breaks lower.
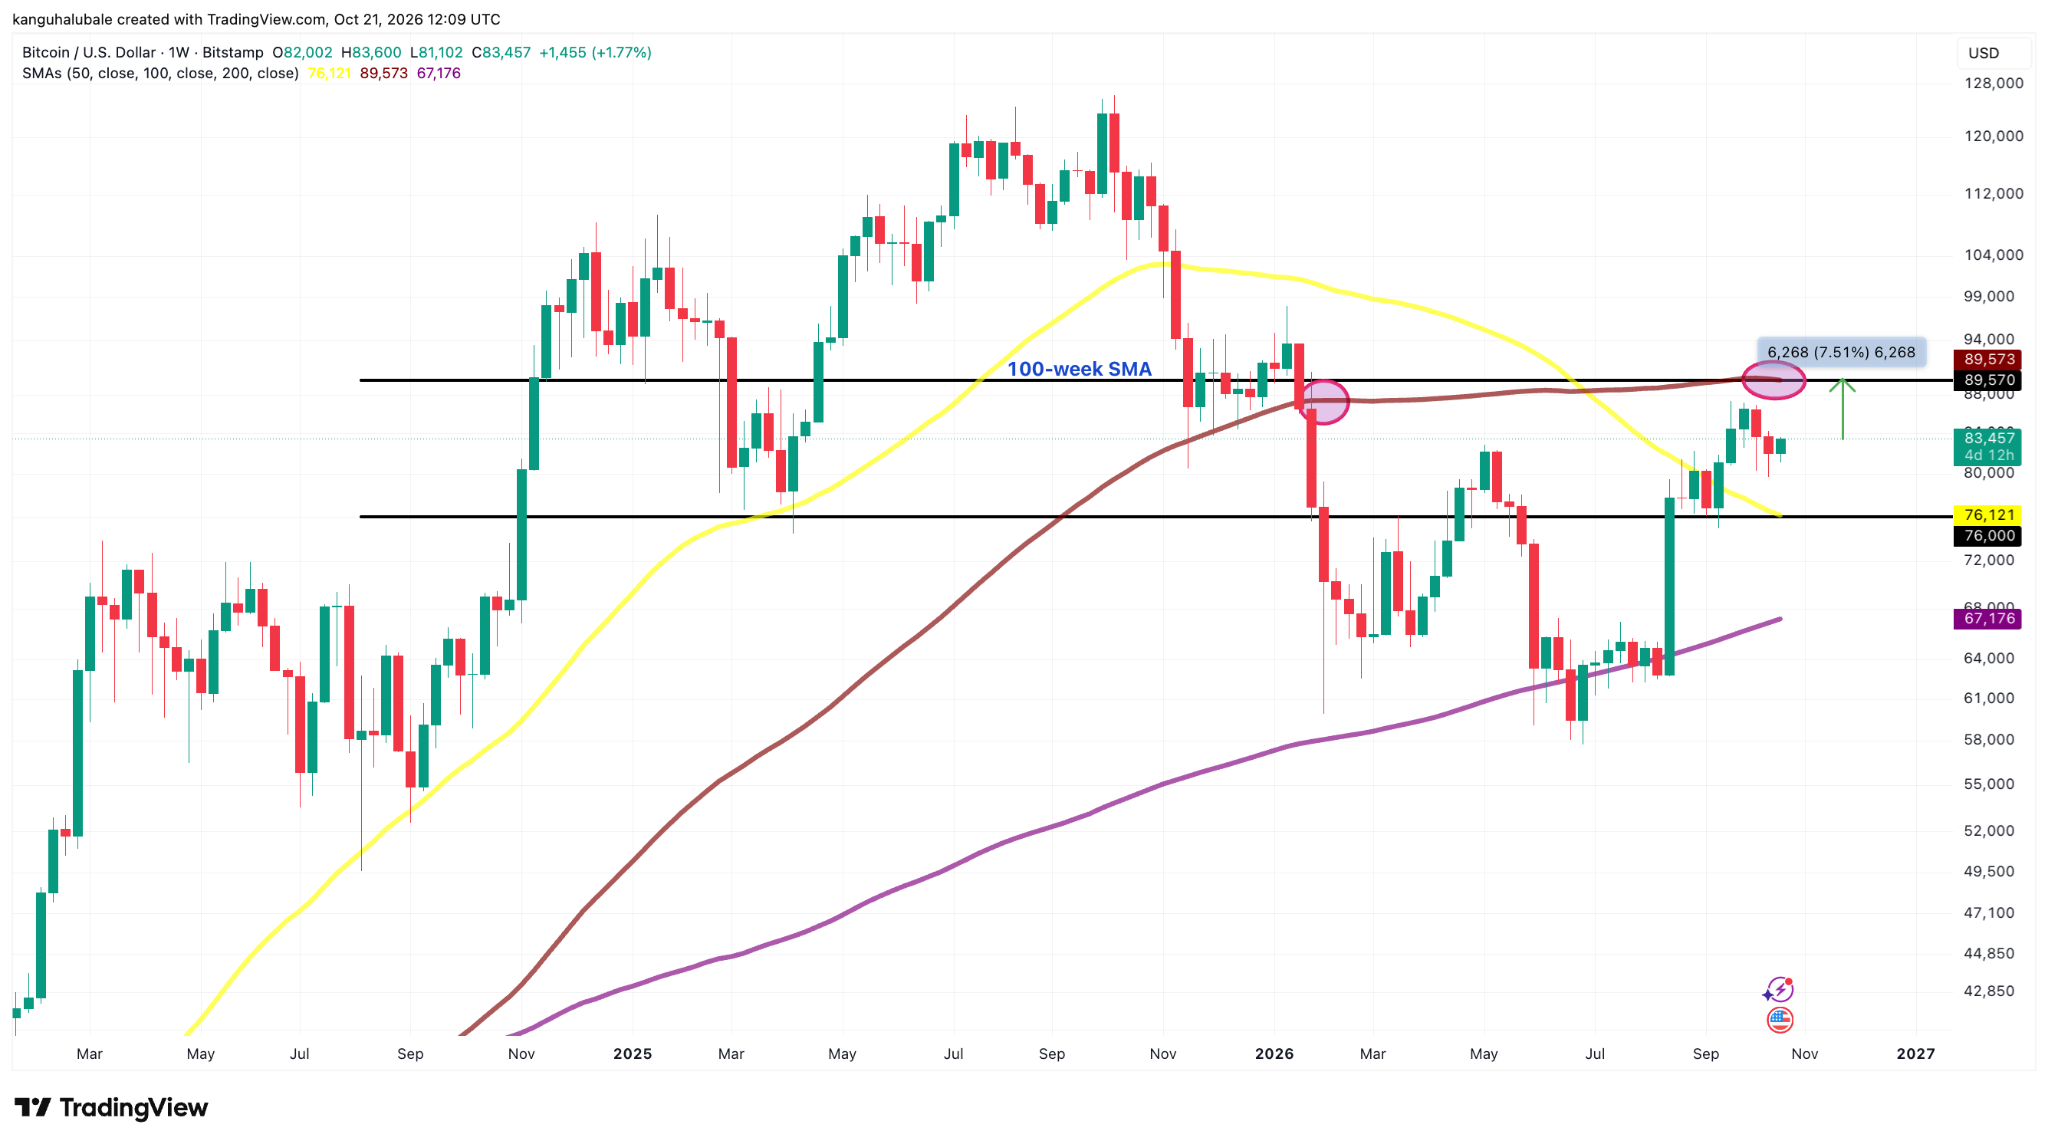
BTC/USD weekly chart. Source: TradingView
The $80,000-$84,000 range has contained much of the recent price action, reflecting a market in which buyers are attempting to stabilize prices but have yet to establish a convincing breakout.
The immediate challenge is the resistance at $85,000. A sustained move above this area could improve bullish momentum and open the way toward $87,000, where another concentration of liquidation liquidity appears, according to the CoinGlass liquidation heatmap.
If the $87,000 level is broken, it could spark a liquidation squeeze, forcing longs to close positions and driving prices toward $90,000, where big liquidity clusters run up to.
That does not guarantee a move to $90,000, but it makes the level increasingly relevant to the next phase of price discovery.
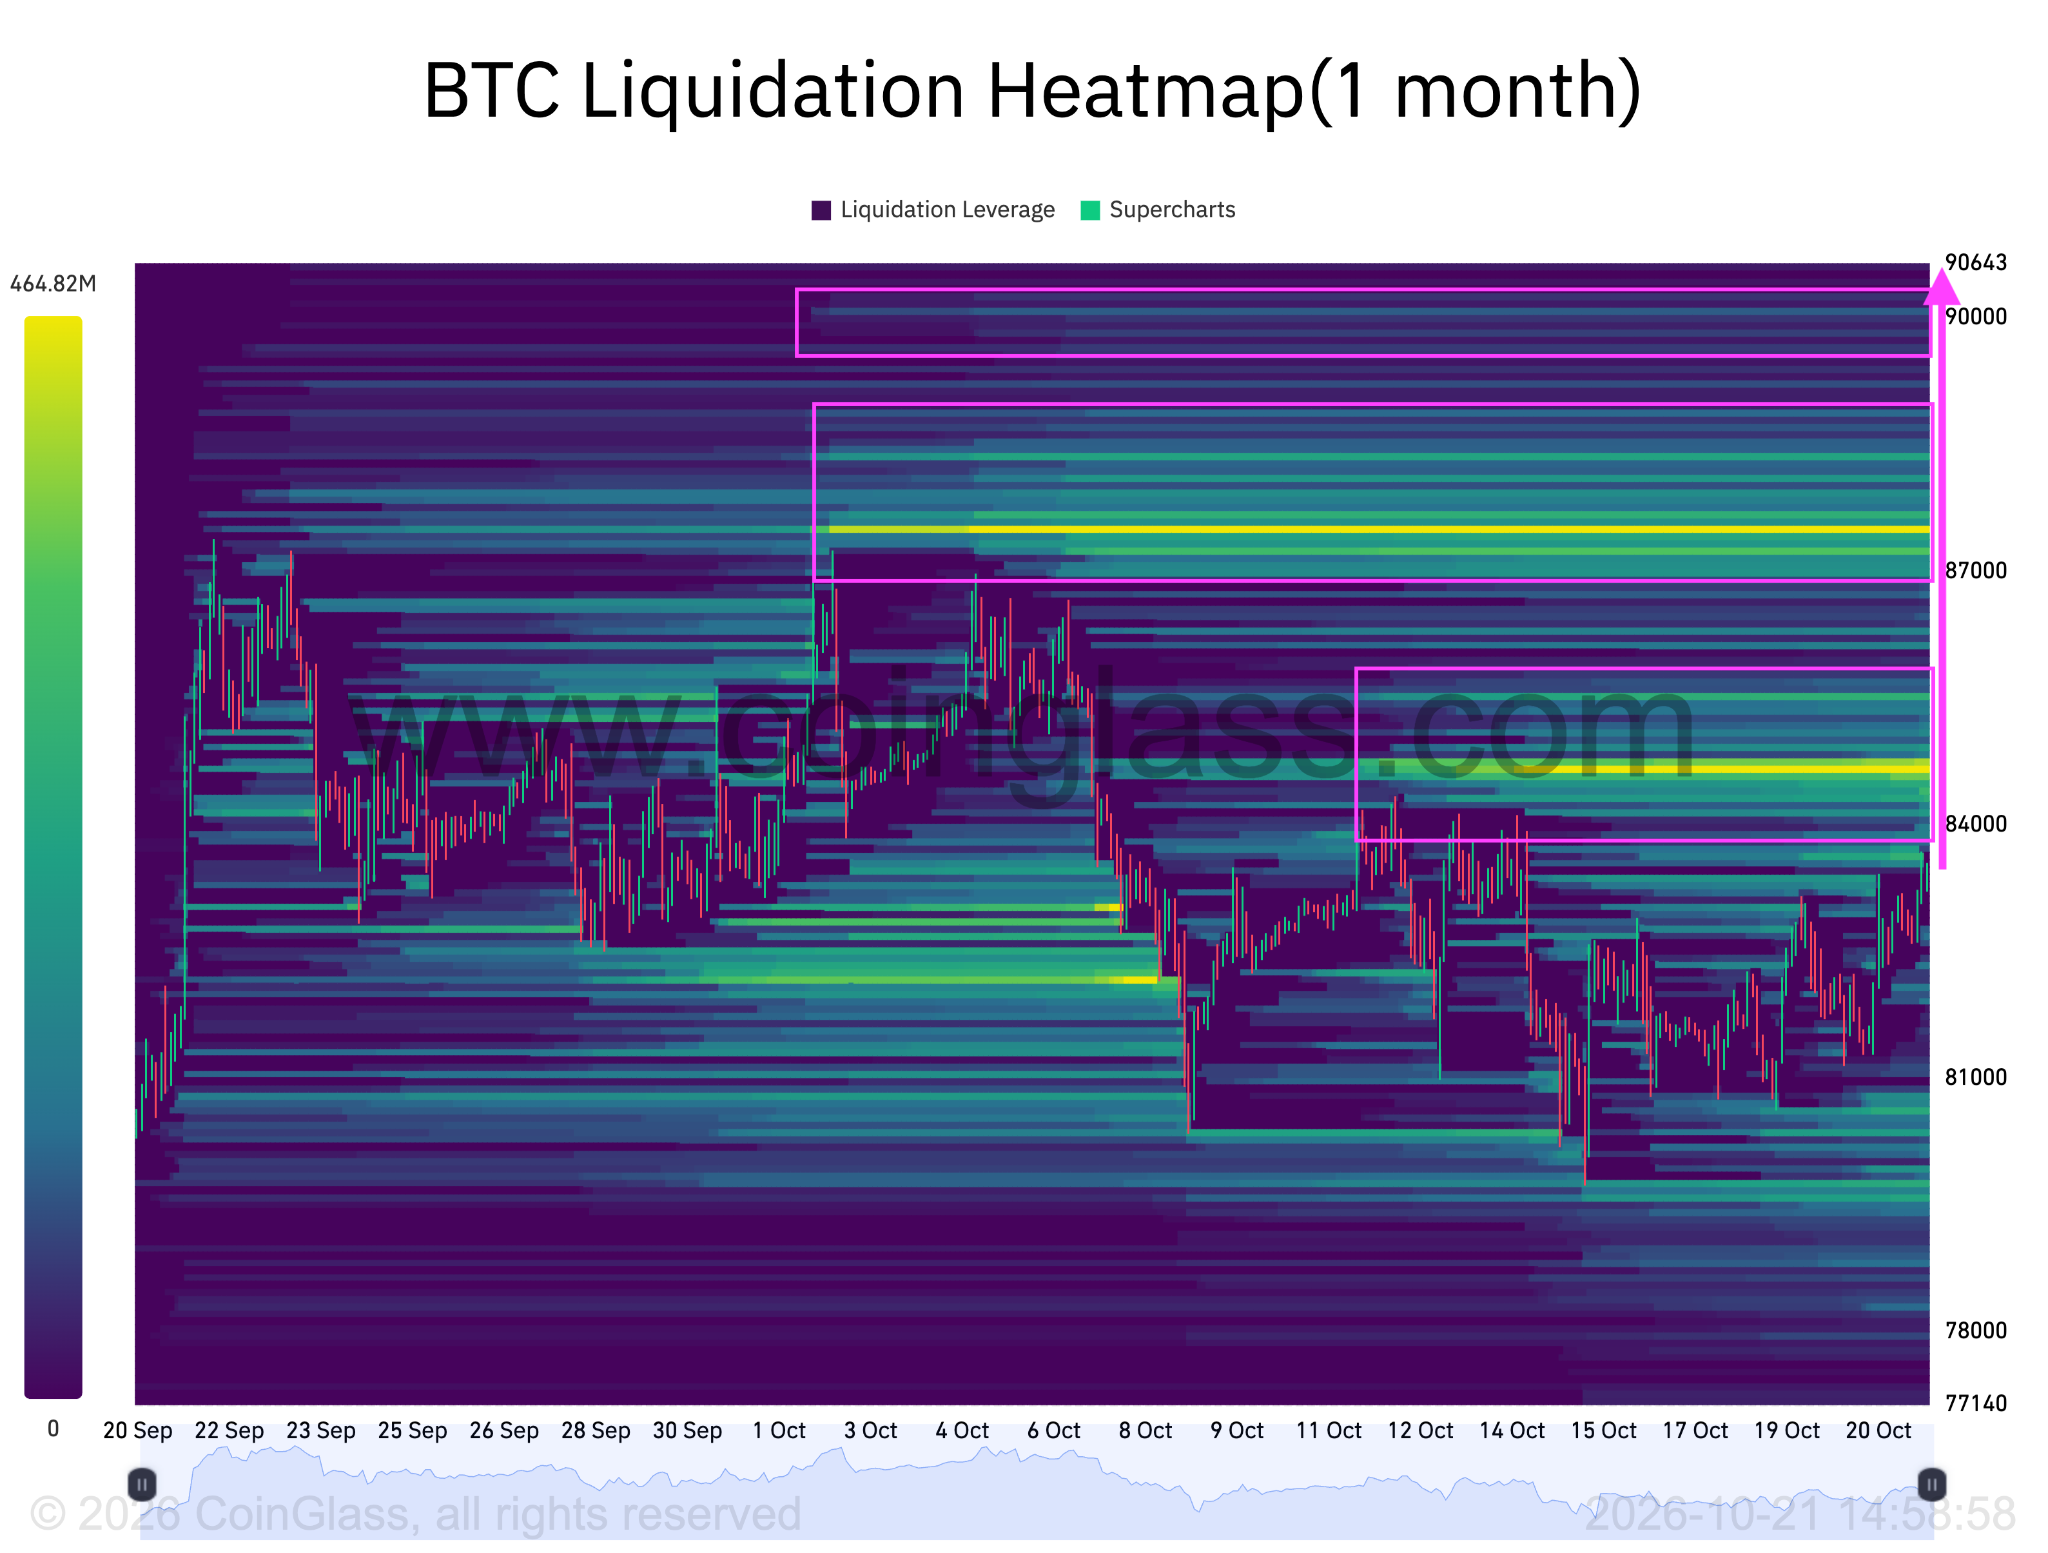
Bitcoin liquidation heatmap. Source: Coinglass
Liquidation heatmaps estimate where leveraged positions may be liquidated; they do not show a guaranteed destination for spot prices, or a complete picture of exchange order-book asks. Nevertheless, clusters of potential liquidations can matter because forced position closures may amplify an existing move.
If Bitcoin rises into an area containing substantial short-position liquidation exposure, forced short covering could accelerate the advance. Conversely, if the price fails to overcome nearby resistance, bullish traders entering with leverage could become vulnerable to a reversal.
This distinction is important: liquidity concentrations can act as price magnets under certain market conditions, but they do not independently determine direction.
For bulls, the most constructive scenario would involve Bitcoin reclaiming the $85,000 level, advancing through $87,000 and eventually challenging $90,000. A decisive weekly close above the 100-week SMA would provide stronger evidence of a broader trend recovery than an intraday spike alone.
MN capital founder Michael van de Poppe acknowledged Bitcoin’s range-bound price action, saying he expects a “strong market move” if BTC/USD breaks below $80,000 or above $83,000.
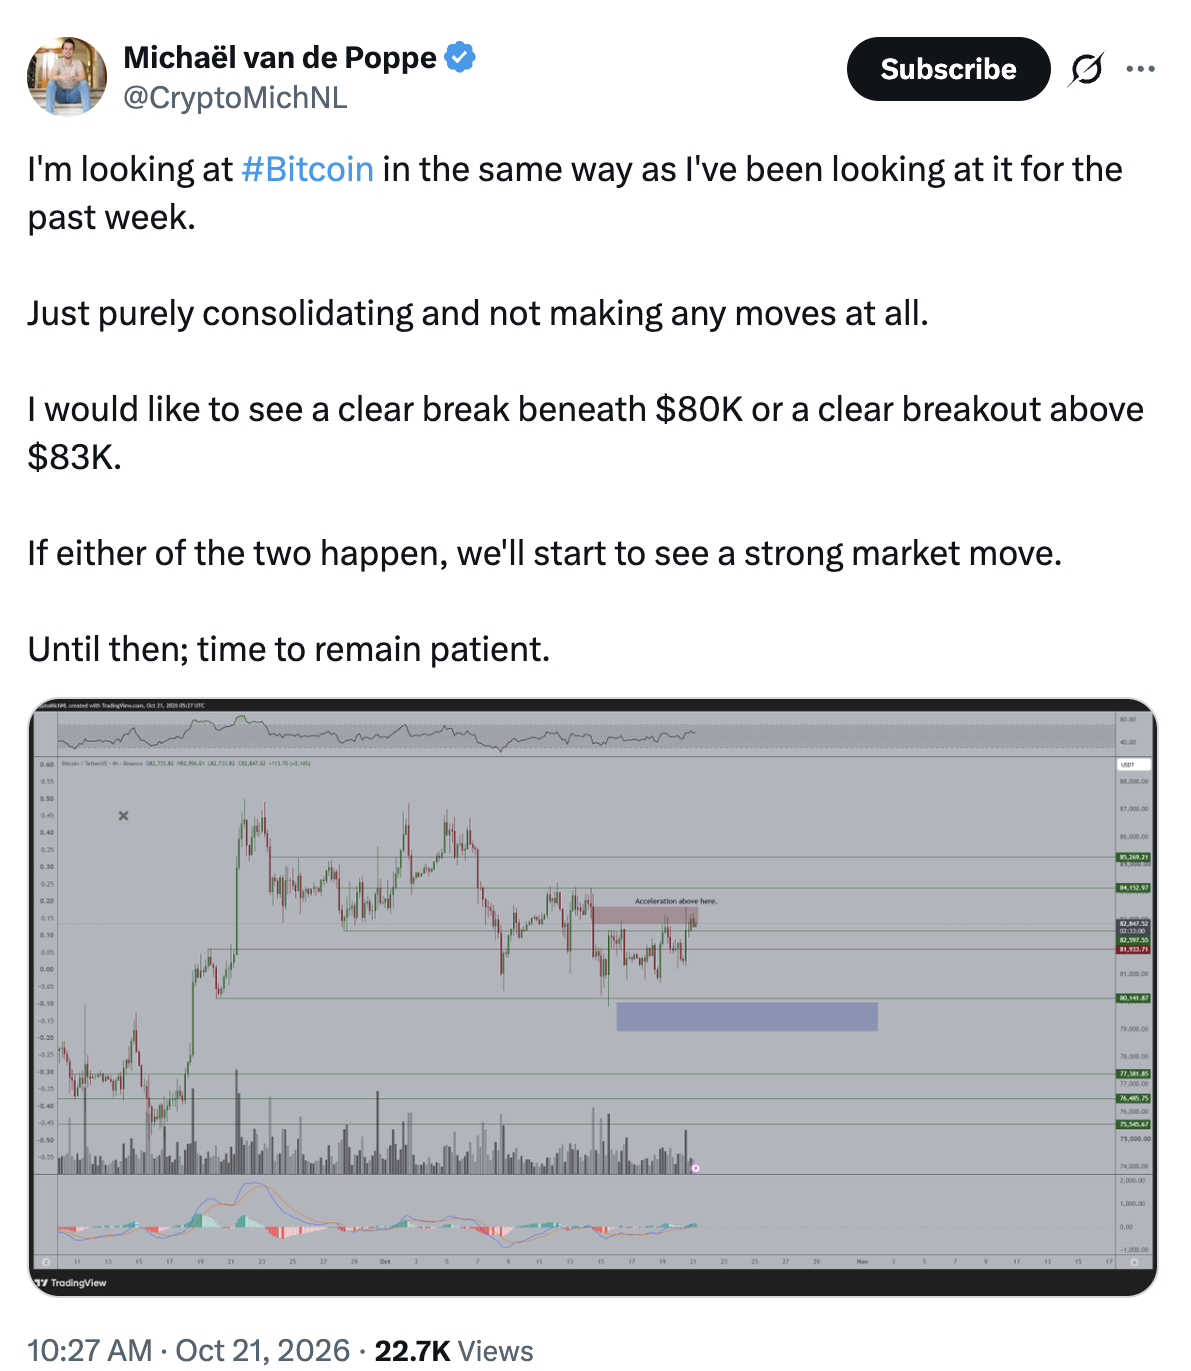
BTC/USD daily chart. Source: Van de Poppe/X
ETF Inflows Put Bitcoin’s Recovery Attempt in Focus
Renewed institutional demand is providing a potential fundamental catalyst for Bitcoin's recovery attempt. US spot Bitcoin ETFs recorded net inflows on Oct. 19 and Oct. 20, reversing the previous session's outflow and offering evidence that institutional investment demand has not disappeared despite recent price weakness.
According to SoSoValue data, spot Bitcoin ETFs attracted approximately $526.6 million in net inflows on Monday, Oct. 19. This was their largest single-day inflow since Sept. 22, when the funds attracted approximately $714.75 million.
The recovery continued on Oct. 20, when US spot Bitcoin ETFs recorded another $23.16 million in net inflows, according to a report citing SoSoValue data. The second session's inflows were considerably smaller, but they extended the positive streak to two trading days.
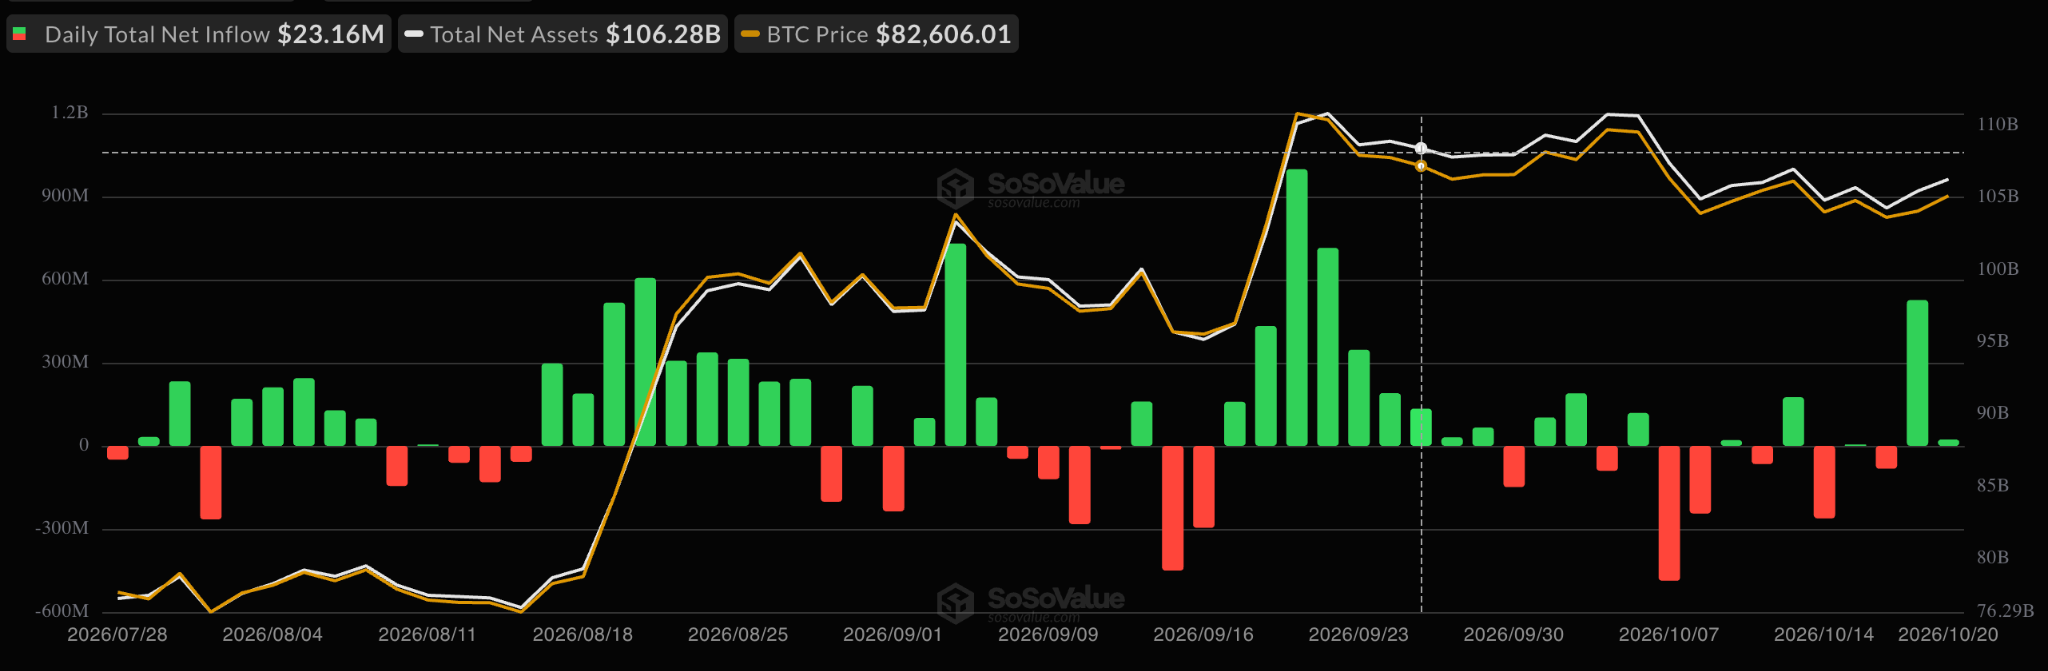
Spot BTC ETF flows chart. Source: SoSoValue
On Monday,BlackRock's iShares Bitcoin Trust (IBIT) attracted approximately $665.2 million, while several other funds recorded outflows. The combined net inflow therefore reflects substantial demand concentrated in one product rather than uniformly strong buying across the ETF market.
This concentration makes the next few sessions important. Sustained positive flows across multiple funds would offer stronger evidence of broadening institutional demand than a single large inflow followed by smaller or negative readings.
The interaction between ETF demand and liquidation liquidity could also shape Bitcoin's next move. ETF inflows provide an indication of net capital entering regulated spot investment products, while liquidation heatmaps estimate where leveraged positions may be forced to close. These indicators measure different aspects of the market, but together they help explain how buying demand and derivatives positioning could influence short-term price action.
If ETF inflows continue while Bitcoin holds above $80,000, spot demand could help absorb selling pressure and support another attempt toward $90,000.
“ETF buyers came back in size yesterday. US spot $BTC ETFs took in $663M, the most in a day since September, and all of it went into BlackRock's IBIT,” onchain data provider Glassnode said in an X post on Tuesday, adding:
“That single day erased the funds' net outflows for October. Follow-through would confirm the demand is back.”
Still, the recent inflows are not sufficient to confirm a sustained bullish reversal. The funds had experienced net withdrawals earlier in October, and Monday's large inflow was followed by a much smaller positive reading on Tuesday. A renewed outflow streak, weakening spot demand or a rejection at technical resistance could undermine the recovery narrative.
Macroeconomic conditions also remain relevant. Changes in interest-rate expectations, bond yields and broader investor appetite for risk can affect demand for Bitcoin and other volatile assets. Consequently, even supportive ETF flows may struggle to sustain a rally if financial conditions deteriorate.
The key question is whether institutional demand persists long enough to help Bitcoin overcome the resistance visible on the weekly chart. Until the price breaks out convincingly, the $90,000 target remains a plausible bullish scenario rather than a confirmed market direction.
What Could Confirm or Challenge Bitcoin’s Recovery
Bitcoin’s outlook is cautiously bullish, but the breakout remains unconfirmed. The $90,000 level is the key resistance, with the 100-week SMA near $89,573 aligning with significant potential liquidation liquidity. Meanwhile, renewed institutional demand supports the recovery, as spot Bitcoin ETFs recorded $526.6 million in net inflows on Oct. 19, followed by $23.16 million on Oct. 20. However, losing support at $80,000 could expose Bitcoin to further selling pressure, with the 50-week SMA near $76,121 serving as the first line of defense.
Until then, Bitcoin remains in a consolidation phase, with the next directional move likely to depend on whether buyers can turn improving demand into a decisive technical breakout.
Ready to trade our analysis of Bitcoin? Here’s our list of the best MT4 crypto brokers worth reviewing.