


King Crypto’s next major move may depend on more than price action alone. As the market consolidates after a strong recovery, Bitcoin’s profitability indicator is approaching a crossover that has coincided with important turning points in its price history. At the same time, the daily chart shows BTC trading within a narrowing formation, with resistance overhead and a potential six-figure price target.
Top Regulated Brokers
Together, these signals offer a constructive case for Bitcoin, but neither guarantees that another sustained bull run is beginning. The onchain crossover is still developing, while the technical pattern needs a confirmed breakout to validate its projected target. Whether the two signals align could help determine if the current consolidation becomes a launchpad for further gains or another failed recovery.
Bitcoin’s Profitability Data Nears a Key Crossover
On-chain data continues to offer a longer-term perspective that price alone does not always capture. The chart below shows the 365-day simple moving averages (365-day SMAs) of realized profit and realized loss converging, with the loss average approaching a bullish crossover above the profit average. Similar intersections appeared around earlier market-cycle turning points in 2012, 2015, 2018 and 2022.
Realized profit measures the gains investors lock in when they spend or sell Bitcoin at a price above the asset’s previous onchain acquisition price. Realized loss measures the losses recorded when coins move at a price below their previous cost basis.
According to onchain data provider Glassnode, these metrics can help assess changes in market sentiment, profit-taking and capitulation. Shifts in the balance between profits and losses can also signal potential changes in the broader market regime.
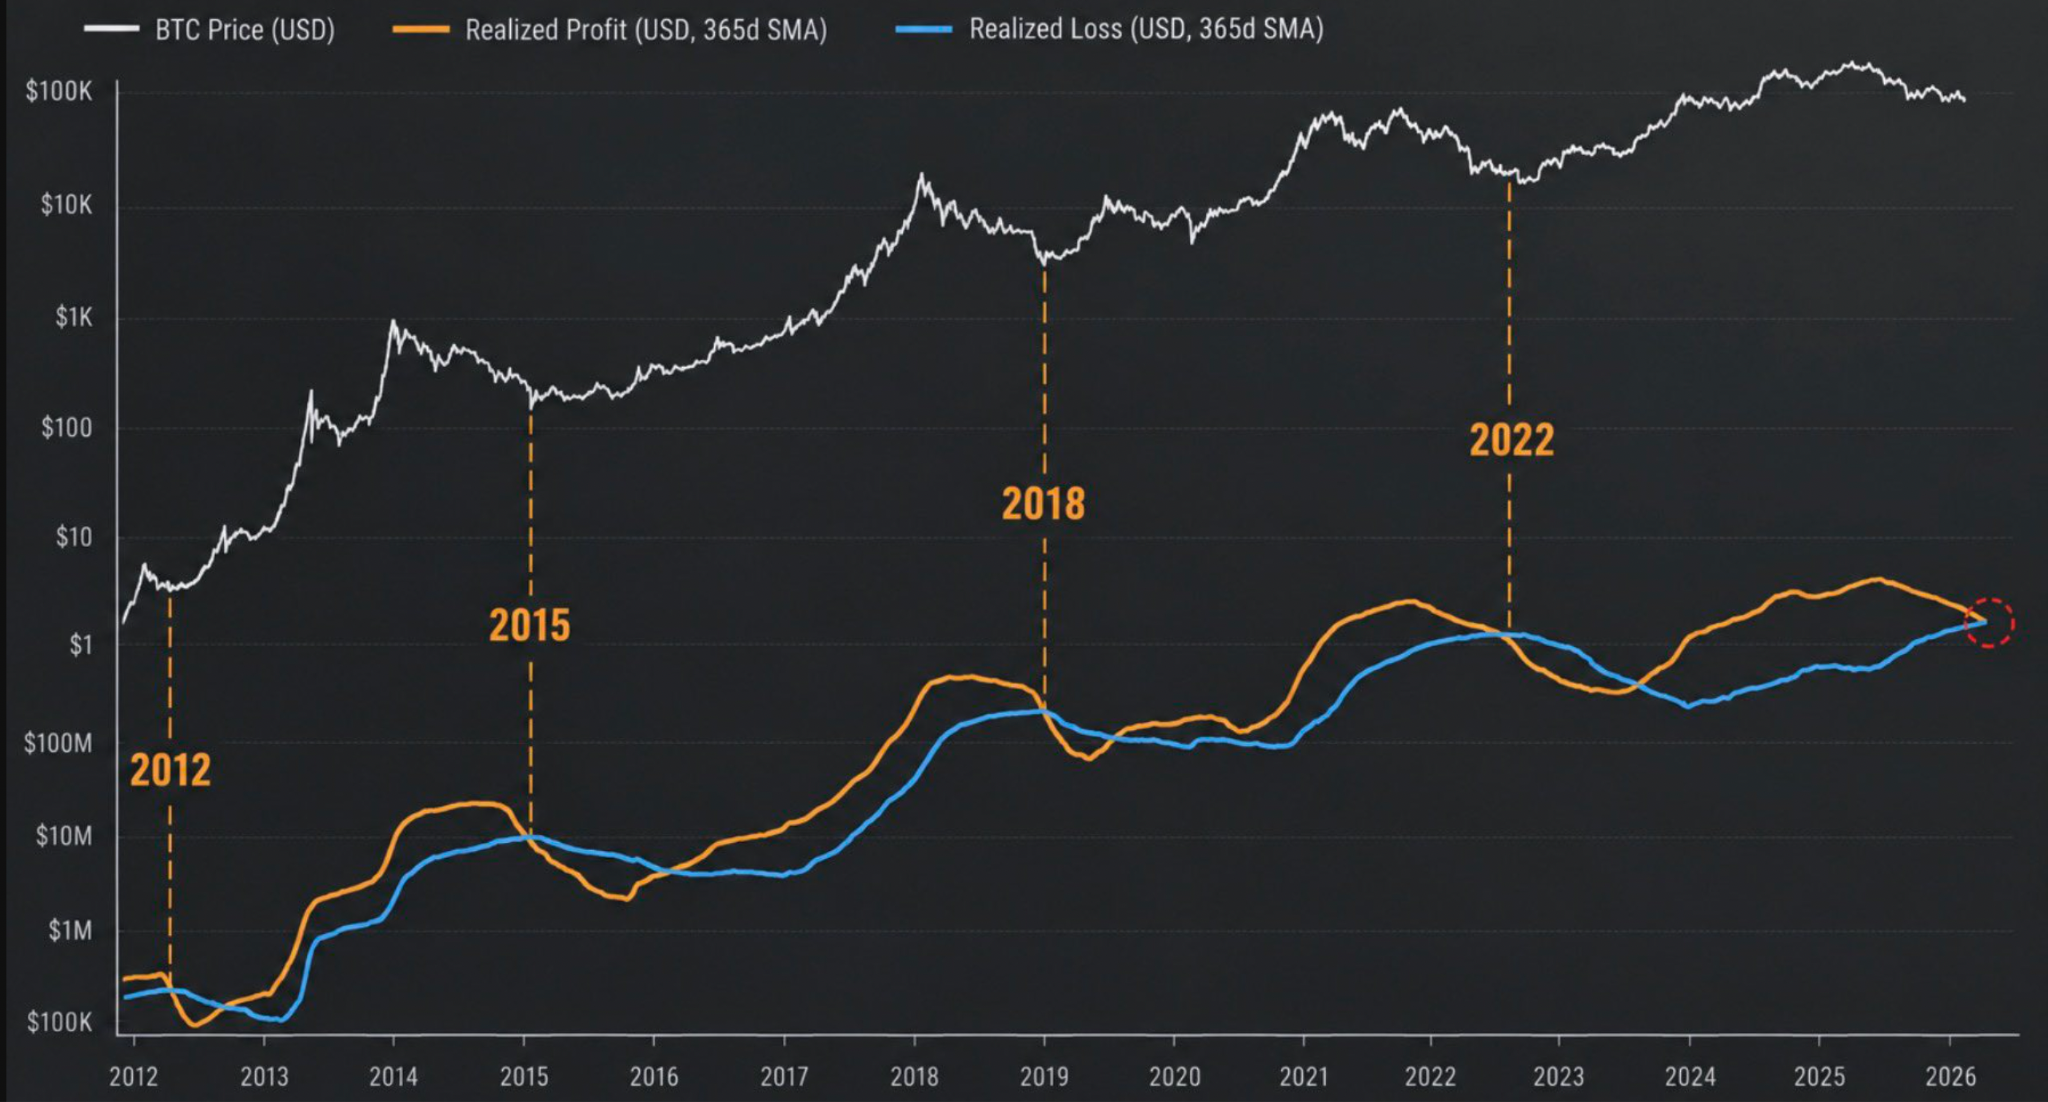
Bitcoin: Realized profit and realized loss chart. Source: Quinten/X
The potential crossover is significant because it may reflect a transition from persistent loss realization toward a market in which investors are increasingly willing to transact at a profit. In previous cycles, similar patterns developed around periods when Bitcoin was emerging from extended weakness.
In each of those earlier instances, the crossover coincided with the early stages of extended upward phases.
The 2022 cycle offers the clearest illustration of the potential upside. Bitcoin fell to around $15,500 in November 2022 before embarking on a recovery that eventually carried it above $126,000 in October 2025. That represents an increase of more than 700% from the cycle low.
Analysts have also highlighted Bitcoin’s market structure and potential direction.
“The bullish cross is about to happen on #Bitcoin,” MN Capital founder Michael van de Poppe said in a post on X last week, adding:
“Every time that this takes place, it's the start of the next big impulse move on Bitcoin and therefore a new bull market.”
Bitcoin Tests Pennant Resistance Near $83,600
The BTC/USD price action itself has painted a classic bullish chart pattern in the daily time frame.
This is a bull pennant, signalling that an uptrend is likely to resume with a potential breakout higher.
A bull pennant typically develops when a sharp upward move (the flagpole), is followed by a period of consolidation within converging trendlines. The pause can allow the market to digest earlier gains before traders determine whether buying pressure is strong enough to resume the advance. The pattern is considered bullish because it forms after an upward impulse, but its projected target is conditional on a confirmed breakout.
In this case, a decisive move above the upper trendline of the pattern at $83,637 would be an initial sign that buyers are overcoming nearby resistance. A sustained breakout above the upper trendline, preferably supported by stronger trading volume, would provide more meaningful confirmation.
The measured target of the pattern, calculated by adding the flag pole’s height to the breakout point above the pennant’s resistance at $83,600, points squarely to $97,500, an 18% uptick from the current price.
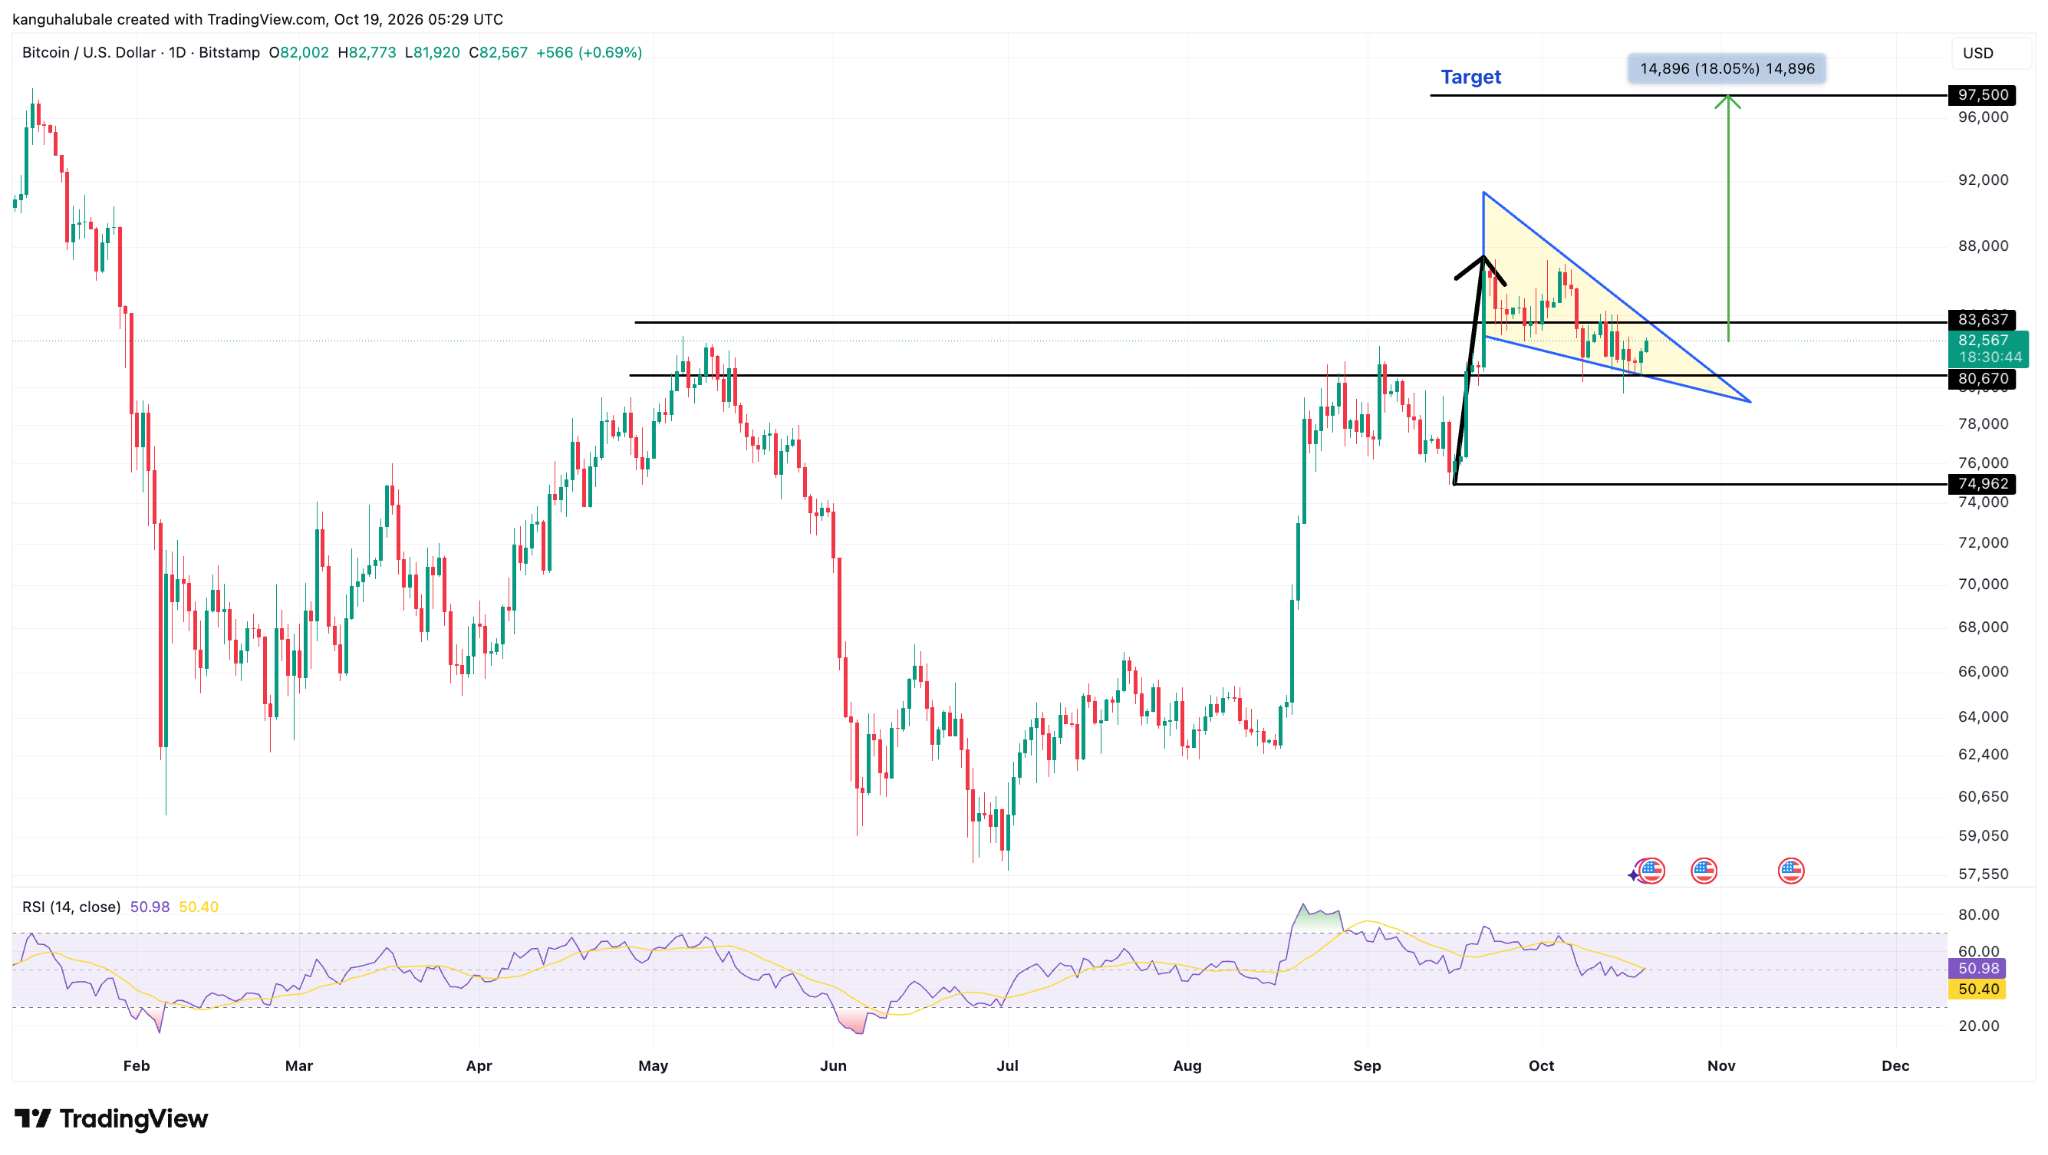
BTC/USD eight-hour chart. Source: TradingView
However, the Relative Strength Index (RSI) provides a note of caution. The indicator is near 51, with its moving average around 50.4. This places momentum close to neutral rather than in strongly bullish territory. The RSI is no longer showing the kind of pronounced strength that would independently confirm an accelerating trend, but it is also not signalling an oversold market.
Therefore, the onchain and technical signals should be used in combination when making a decision. The crossover may suggest that investor losses and profits are approaching a historically important balance, while the pennant outlines the price level needed to demonstrate renewed buying pressure. A breakout supported by improving onchain demand would make the bullish case more persuasive than either signal in isolation.
What Could Confirm—or Challenge—the Setup
When the on-chain crossover pattern is viewed alongside the daily bull pennant, the two frameworks point in a similar directional bias without guaranteeing results. The realized profit and loss averages have aligned in ways that previously preceded multi-year advances, including the substantial recovery that followed the 2022 crossover.
At the same time, the technical structure on the daily chart offers a defined continuation target should the pennant resolve higher. The combination suggests a market that has absorbed prior distribution and is now testing whether fresh demand can reassert itself. Complacency remains a potential risk if participants assume the historical pattern will repeat automatically. Equally, a failure of the pennant to break higher or a reversal in the on-chain trajectories would challenge the constructive interpretation.
What remains open is how these elements interact over the coming sessions and weeks. The convergence of the longer-term profitability averages and the resolution of the daily consolidation will provide clearer evidence of whether the current chapter resembles earlier cycle transitions or develops along a different path.
Ready to trade our analysis of Bitcoin? Here’s our list of the best MT4 crypto brokers worth checking out.