


Top Regulated Brokers
The market environment is seeing an even stronger US Dollar that is overcoming almost every other currency – including this one, and we are generally seeing risk sentiment deteriorating. All risky assets faced some setback over the past day and the GBP/USD currency pair was no exception. US Treasury Yields are rising to highs not seen since 2007, with the 10-Year Yield reaching 5.24%.
This leads to a bearish picture, but we are very close to some key lows which could trigger either an important technical reversal, or a significant bearish breakdown.
GBP/USD Fundamental Analysis
The US Dollar’s fundamental outlook remains bullish in the short term. The Fed’s recent rate hike and its indication that further tightening may be necessary have lifted the Dollar Index to near 101.00, close to its highest level since July, as markets price roughly a 62% probability of two 0.25% rate hikes by the end of the year. High US yields and persistent inflation risks support the greenback, and global investment capital has continued to flow into the USA, with President Trump doing everything he can to keep this going.
The pound has some support from UK interest rates: the Bank of England held its policy rate at 3.75% in September, while August inflation reached 3.1%, above its 2% target. That keeps the possibility of further rate rises in focus, which could help sterling. The counterweight is weak growth and higher energy costs, which could squeeze households and businesses. Overall, the fundamental outlook is cautiously supportive for the pound, but clearly not as strong as it is for the greenback.
GBP/USD Technical Analysis
The price has moved down from the high of its 18-month range over the past month to get quite close to the low of that same range, which is quite impressive momentum, even though this range is not especially large. The price is now approaching the low and this could be where action starts to get very significant.
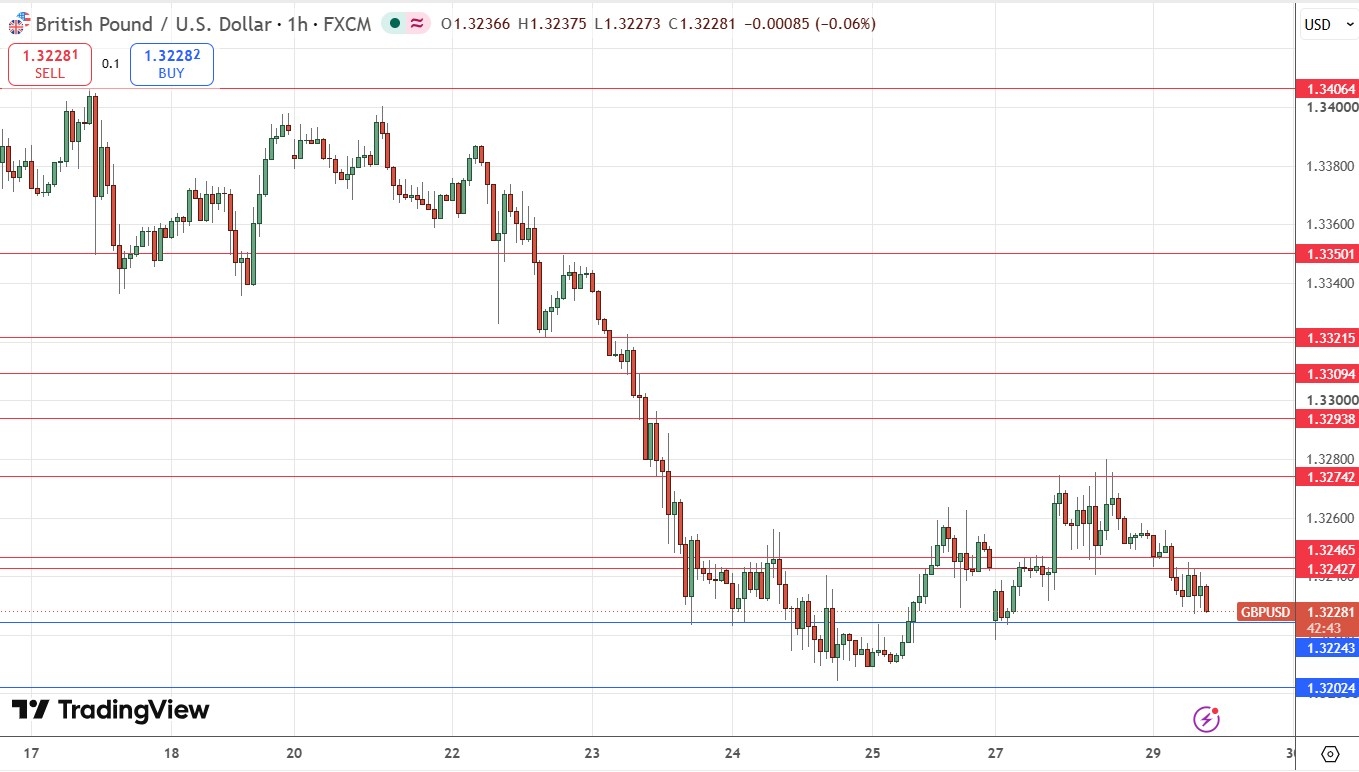
Zooming in with an hourly chart, although we have seen a higher low and two higher highs over the past few days, the microstructure of the past day is very bearish, and in context, the price looks likely to head for the recent low at about 1.3200 after establishing new resistance levels at 1.3243, 1.3250 (a significant quarter number), and 1.3277. I think the latter two points could be turning points for renewed down legs after any bullish retracement.
Looking to lower levels, the support at 1.3202 looks very significant, although there is also higher support at 1.3224. A break below 1.3200 would open the way to a test of the 9-month low at 1.3140.
My Take on the GBP/USD
The picture looks bearish, but when long-term lows are approached in Forex, you really should be cautious. The levels which really stand out as significant are 1.3250 and 1.3200. I think a failed test of 1.3250 could provide an excellent short trade entry, but I would also take that at 1.3277 or even 1.3275. If the price gets established below 1.3200 then the test of 1.3140 becomes extremely significant.
I do not see any potential for a long trade today. One thing to watch out for could be a rejection of the area below 1.3200 towards the end of the week if the big US data releases surprise dovishly and send the US Dollar lower. President Trump is going to do everything he can to get long-term yields heading downwards again. Whether he will be able to accomplish this is another question.
Review, Support & Resistance Levels
My previous GBP/USD free signal on 23rd September was not triggered.
New trades should only be entered prior to 5pm London time today.
Long Trade Ideas
Go long following a bullish price action reversal on the H1 timeframe immediately upon the next touch of $1.3224, 1.3202, or 1.3140,
Put the stop loss 1 pip below the local swing low.
Adjust the stop loss to break even once the trade is 25 pips in profit.
Take off 50% of the position as profit when the price reaches 25 pips in profit and leave the remainder of the position to ride.
Short Trade Idea
Go short following a bearish price action reversal on the H1 timeframe immediately upon the next touch of $1.3223, 1.3243, or 1.3274.
Put the stop loss 1 pip above the local swing high.
Adjust the stop loss to break even once the trade is 25 pips in profit.
Take off 50% of the position as profit when the price reaches 25 pips in profit and leave the remainder of the position to ride.
The best method to identify a classic “price action reversal” is for an hourly candle to close, such as a pin bar, a doji, an outside or even just an engulfing candle with a higher close. You can exploit these levels or zones by watching the price action that occurs at the given levels.
There is nothing of high impact scheduled today concerning either the British Pound or the US Dollar.
Ready to trade our free Forex signals? Here is our list of the best Forex brokers worth checking out.