


Bullish view
Top Regulated Brokers
Buy the BTC/USD pair and set a take-profit at 87,270.
Add a stop-loss at 80,000.
Timeline: 1-2 days.
Bearish view
Sell the BTC/USD pair and set a take-profit at 80,000.
Add a stop-loss at 87,270.
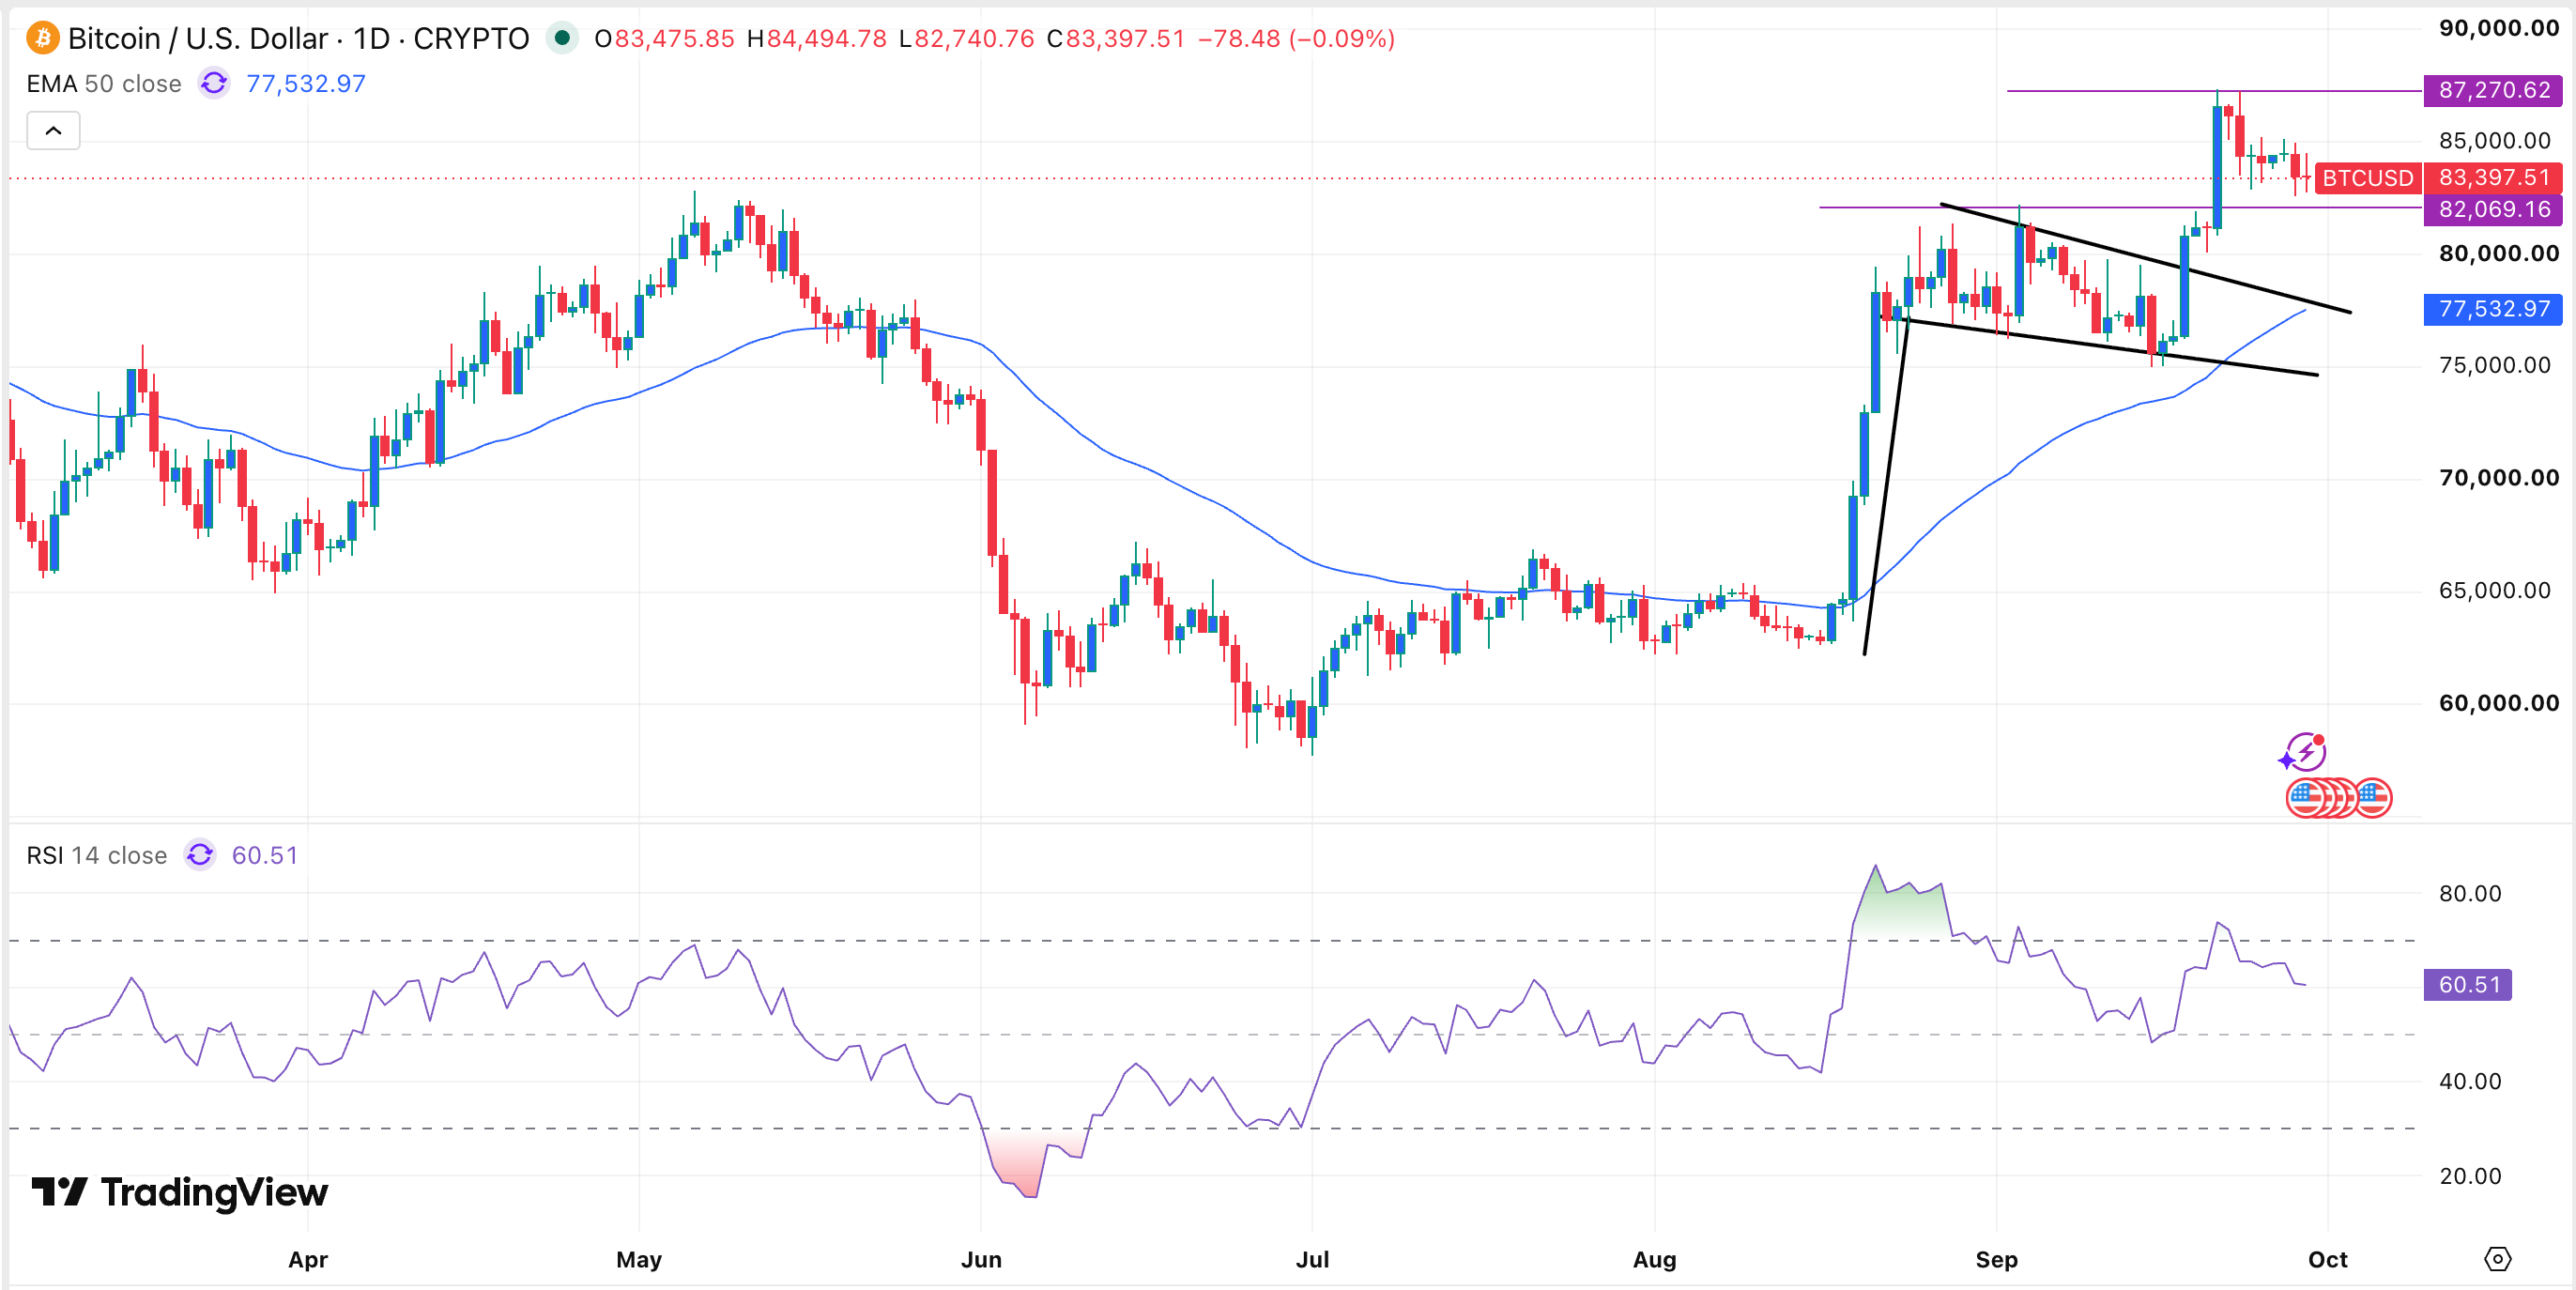
Bitcoin's price has pulled back over the past week as momentum faded. After climbing to $87,270, it gave up those gains and now trades at $83,473, as US bond yields surged and investors began booking profits. Still, the coin has formed a bullish flag pattern, which points to a rebound in the near term.
Bitcoin’s retreat has coincided with the soaring US bond yields, which is putting more pressure on non-yielding assets, including gold. The ten-year yield has crossed the important resistance level of 5.24%, while the 30-year jumped to 5.6%.
US bond yields are rising because of the ongoing deficit spending and the fact that the economy is not growing as faster as expected.
Bitcoin is also wavering as demand for ETFs drops. These funds have attracted $2.73 billion in inflows this month, much lower than the $3.52 billion they added last month. In total, spot Bitcoin ETF inflows have jumped by over $6.5 billion in the last three months, which is a positive thing.
The next important catalyst that may move Bitcoin is the upcoming US jobs numbers, which will provide hints on what to expect from the Fed. ADP will release the nonfarm private payrolls later today, while the Bureau of Labor Statistics (BLS) will publish the official report on Friday.
These numbers are important because they will provide more hints on what to expect from the Fed. Bitcoin normally underperforms the market whenever the Fed is highly hawkish.
BTC/USD Technical Analysis
The daily chart shows that the BTC/USD pair topped at 87,270 on September 21 and then pulled back to the current 83,430. This retreat has seen it move close to the key support level of 82,070, its highest level on 3rd September. That is a sign that it is about to form a break-and-retest pattern, which is a common bullish continuation sign.
Bitcoin has also held steady above the 50-day Exponential Moving Average (EMA), which is a highly bullish sign in technical analysis.
Therefore, the most likely scenario is that it resumes the uptrend, potentially to the September high of 87,270. A move above that level will point to more gains, potentially to the psychological level of 90,000. On the flip side, a drop below the support of 80,000 will point to more downside.