


Bullish view
Top Regulated Brokers
Buy the BTC/USD pair and set a take-profit at 90,000.
Add a stop-loss at 80,000.
Timeline: 1-2 days.
Bearish view
Sell the BTC/USD pair and set a take-profit at 80,000.
Add a stop-loss at 90,000.
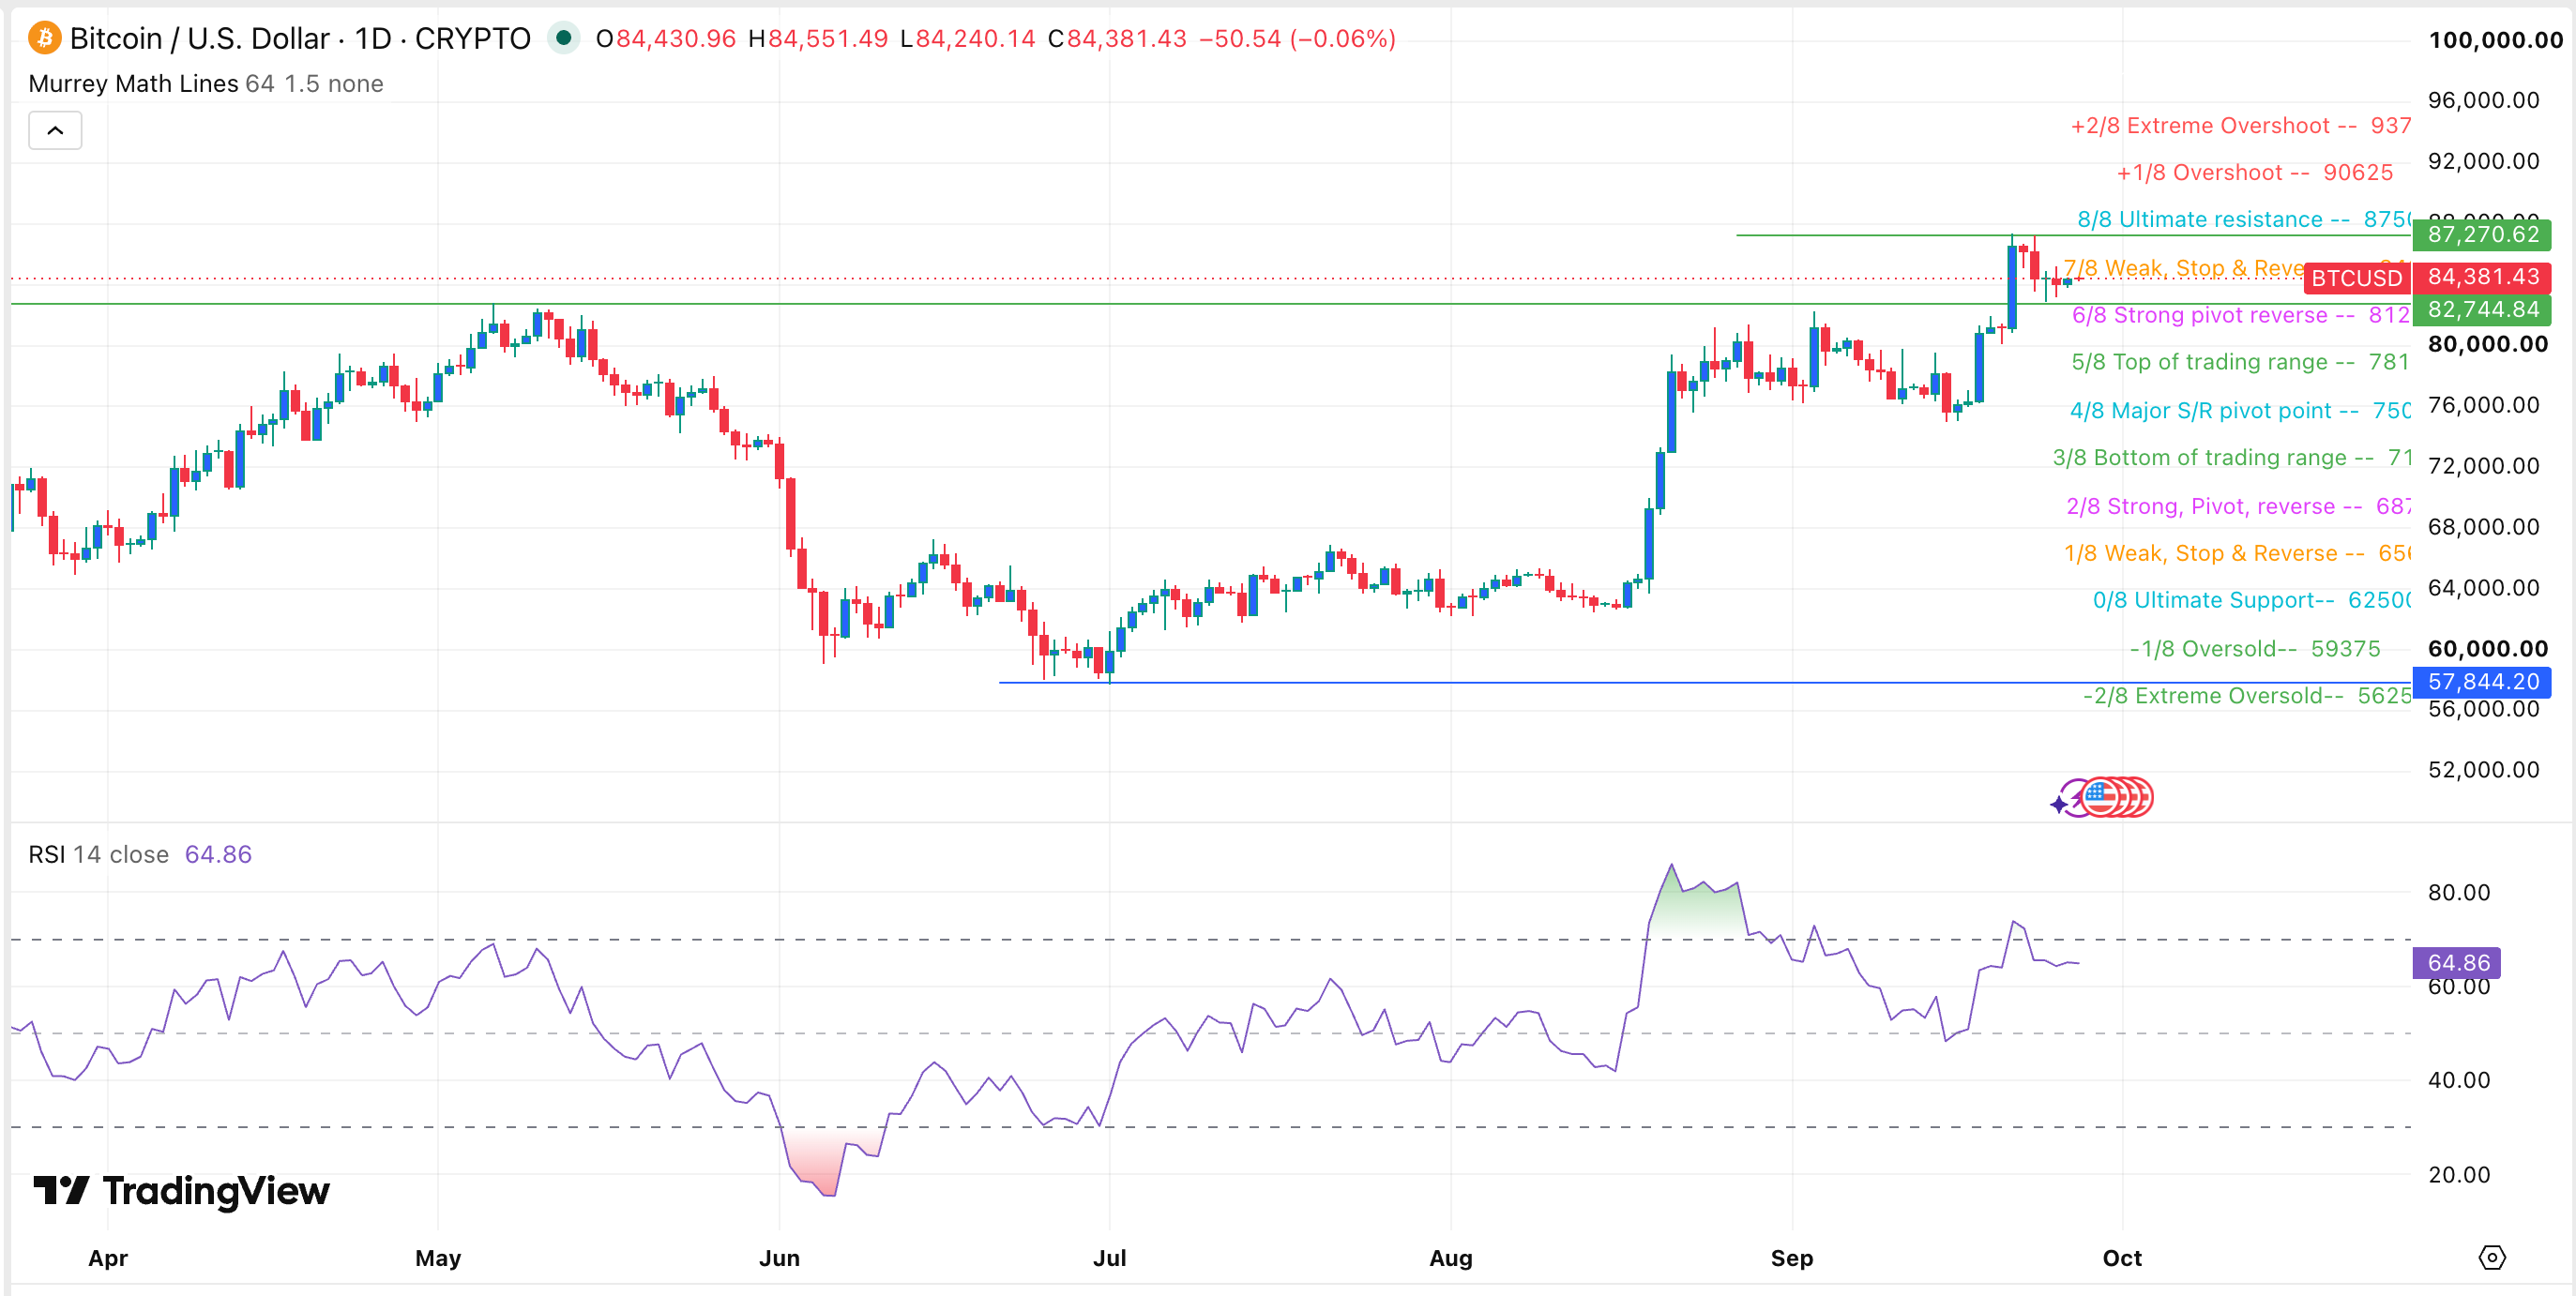
Bitcoin's price remains above the key support level of $84,000 as demand for the coin continues despite rising bond yields. BTC/USD pair was trading at 84,380, a few points below this month’s high of 87,270. It remains much higher than the July low of 57,800.
Bitcoin Demand Remains Steady
The BTC/USD pair has done well in the past few months, moving from 57,800 in July to the current 84,355. This rebound coincided with the rising demand among institutional investors. Michael Saylor’s Strategy bought 95 coins a week ago, and the company likely bought more. Strive, which is associated with Vivek Ramaswamy, has also been in a buying spree.
Spot Bitcoin ETF inflows also continued rising this month. These funds have added over $2 billion in inflows this month, bringing the cumulative inflows to over $57 billion. The funds have over $107 billion in assets, with BlackRock’s IBIT leading the charge.
Bitcoin has also seen more demand in the futures market, with its open interest continuing the upward trend. These numbers are bullish for Bitcoin as it is a sign that demand has continued rising this year.
Bitcoin’s demand has jumped despite the rising risks in the market. Some of these risks include the rising inflation and soaring crude oil prices. Brent and the West Texas Intermediate (WTI) have jumped to $105 and $93, respectively.
It has also done well even as US bond yields continue rising. The ten-year yield jumped to 5.167%, while the 30-year soared to 5.50%. These numbers are rising because of the surging US debt, with the total amount soaring to $40.2 trillion.
BTC/USD Technical Analysis
The daily chart shows that the BTC/USD pair has retreated from a high of 87,270 to the current 84,380. It has remained much higher than the year-to-date low of 57,800.
The pair has remained above the important support level of 82,745, its highest level in May and September 3. It has also moved above the Strong Pivot Reverse level of the Murrey Math Lines tool.
BTC/USD has remained above the 50-day Exponential Moving Average (EMA). It has formed a break-and-retest pattern, suggesting that it has more upside. If this happens, the next key resistance level to watch being the psychological of 90,000.