


Top Regulated Brokers
King Crypto is carrying two different messages into the next market test. The chart still shows a recovery that has held above its short-term trend, and U.S. spot exchange-traded funds continue to report net inflows. Yet the daily fund bid has faded sharply while BTC/USD remains below the high that started the latest advance.
That combination makes the next move more informative than the streak itself. Bitcoin no longer has to prove that regulated fund demand exists. It must show what happens when that demand becomes thinner as the latest inflation report leaves bond and currency markets weighing persistent price pressure against strong consumer spending.
Why Slowing ETF Inflows Matter Now
Farside Investors reported a ninth straight day of net inflows into U.S. spot Bitcoin ETFs on Tuesday, but the daily amount was far smaller than at the start of the streak. Nearly $1 billion flowed in on September 21, compared with $31 million on September 28 and $66.2 million on September 29.
The sequence shows durable participation and weaker force at the same time. An inflow streak can continue even when the marginal bid is only a fraction of its earlier size. ETF totals also do not identify the investors involved or translate into an equal amount of immediate spot buying. They remain one demand gauge among several, not a mechanical price engine.
Wednesday’s inflation report delivered a mixed backdrop for Bitcoin as ETF inflows slowed. The Bureau of Economic Analysis said the PCE price index rose 0.3% in August and 3.4% from a year earlier, while the core index increased 0.2% for the month and 3.0% year over year. Consumer spending rose 0.9%, including a 0.6% increase after adjusting for inflation. Persistent inflation alongside firm spending may keep rate expectations, Treasury yields and the dollar relevant for Bitcoin and other risk assets.
Bitcoin Holds Above Short-Term Support
Data provided by TradingView placed BTC/USD at $83,570 at the time of writing. TradingView showed BTC down 1.90% for the week, while price remained above the 20-day simple moving average at $81,299 and the 50-day average at $77,270. Bitcoin had recovered from an intraday low of $82,912 after reaching $85,614, leaving the daily trend intact but the market response unsettled.
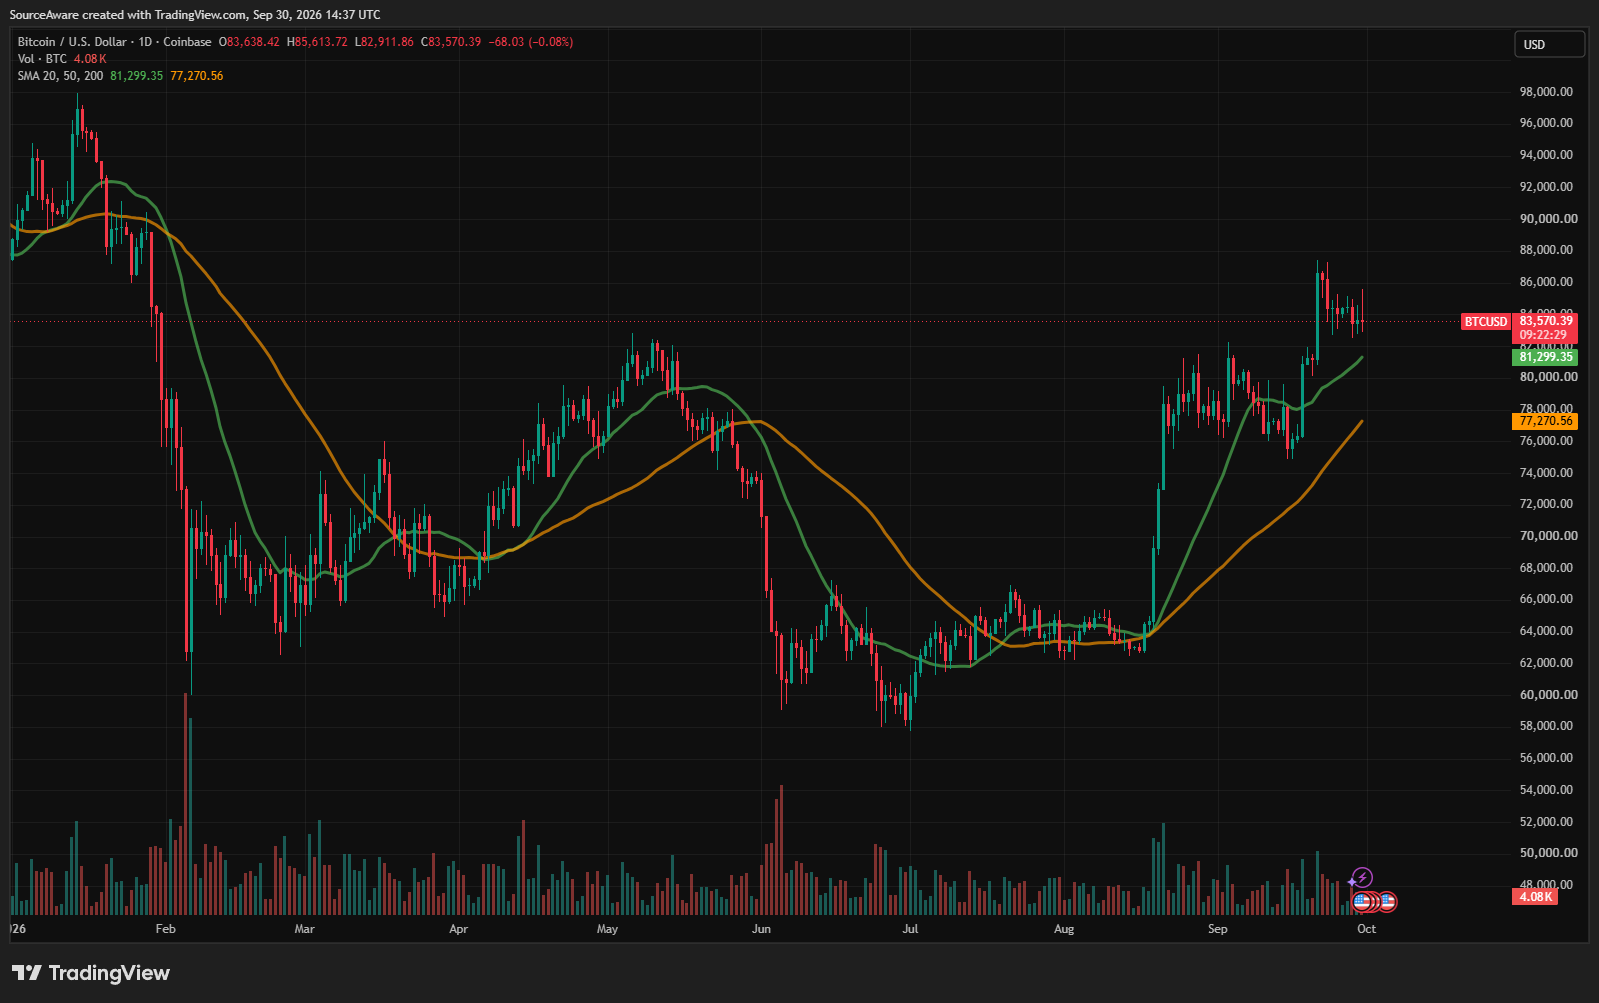
BTC/USD 1-day chart. Source: TradingView
The last two trading sessions show how that tension developed. BTC closed Tuesday at $83,638 after trading between $82,736 and $84,557. Monday's decline reached $82,510 before closing at $83,457. Both sessions stayed below the $87,397 high set on September 21, when the ETF sequence produced its largest daily inflow.
Bitcoin moved through the mid-$84,000s on Wednesday and reached $85,614 before giving back part of the advance. Holding that area would show that buyers can sustain a move above the top of the previous two-day range. It would not complete a larger breakout. The September 21 high near $87,397 remains the more demanding reference above it.
On the downside, Monday's $82,510 low and Tuesday's $82,736 low create a band where buyers have recently responded, and Wednesday’s intraday low of $82,912 held above it. The 20-day average near $81,299 sits below that band. A move toward the average would still leave BTC above its 50-day trend, but it would erase more of the distance built during the earlier advance and make the ETF slowdown harder to dismiss as background noise.
Data from CoinMarketCap shows the total crypto market capitalization is approximately $2.894 trillion, up 0.27% over 24 hours, while Bitcoin dominance is 58.7%, up 0.17 percentage points.
Breadth had also improved. CoinMarketCap shows 57 of the top 100 assets positive over seven days and 43 negative. That split suggests the rebound was not confined to Bitcoin. BTC dominance also edged higher, showing relative resilience while a majority of large assets participated in the broader recovery.
The overall read shows that Bitcoin remains below the prior week's high, but Wednesday’s rebound carried it back through the mid-$84,000s while price stayed above both daily moving averages.
Why a Positive ETF Streak Can Mislead
Nine straight positive ETF sessions show persistent demand, but the daily totals have shrunk sharply. Tuesday’s $66.2 million inflow kept the streak going after nearly $1 billion on September 21. The direction remains positive; the smaller amount offers less evidence of a forceful fund bid at current prices.
The daily aggregate has an important limit. The $66.2 million total does not identify the investors behind the inflow or prove that fund demand alone drove Bitcoin’s price. The category still had a net inflow, and the streak continued. The smaller amount leaves open how much support fund demand can provide if volatility rises.
Wednesday’s PCE report combined a 3.4% annual headline rate with a 3.0% core rate and stronger consumer spending. That mix could keep yields and the dollar sensitive to changes in rate expectations even as Bitcoin tests higher levels. The release alone will not settle the trend. How BTC trades through the rest of the session may show whether recent support can hold without last week’s larger fund inflows.
What Could Keep Bitcoin’s Recovery Intact
The drop in daily flows could mark a return to normal after an unusually large burst rather than a disappearance of demand. Every session in the streak has remained positive, and Bitcoin has held above its 20-day average despite failing to recover the prior high. If BTC holds the recent lows and builds on Wednesday’s move through the mid-$84,000s, the pullback could look more like consolidation as fund buying settles into a slower pace.
The initial recovery after the PCE release supports that reading without settling it. Holding above the short-term trend while ETF totals remain positive would show that Bitcoin can absorb a smaller visible bid. A loss of the recent lows followed by pressure near the 20-day average would make the same flow slowdown more consequential.
What Bitcoin’s Next Close May Reveal
Bitcoin moved higher after the PCE release with support still visible, resistance still intact and a positive ETF streak that is losing numerical force. The first reaction may say less than the close that follows it. Price behavior around the recent two-session lows, the mid-$84,000s and the 20-day average can show whether the current range is absorbing pressure or merely postponing it.
The next complete ETF-flow report will add another piece. A renewed increase would restore weight to the demand story, while another small total would keep attention on the chart's ability to stand without last week's fund impulse. Bitcoin’s trend has survived the slowdown and its first response to the inflation data was higher. Whether that move can hold through the daily close remains open.
Ready to trade our analysis of Bitcoin? Here’s our list of the best MT4 crypto brokers worth checking out.