


Fundamental Backdrop and Market Sentiment
I wrote on 23rd August that the best trades for the week would be:
Long of Sugar. This gave a loss of 0.11%.
Long of the GBP/USD currency pair. This gave a loss of 0.80%.
The total loss of 0.91% averages to 0.46% per asset.
Top Regulated Brokers
A summary of last week’s most important data in the market:
US Core PCE Price Index – this was slightly higher than expected, showing an annualized rate of 3.7%, which gave the US Dollar a lift.
US Preliminary GDP – this was a tick higher than expected, which also helped give the greenback a small tailwind.
Australian CPI (inflation) – this was expected to fall from 3.8% to 3.3%, but it fell only as far as 3.5%, which has put hawkish pressure on the RBA and boosted the Aussie unquestionably over the past few days.
Canadian GDP – this came in a tick higher than expected.
The currencies which were affected by these items last week were the US Dollar, the Australian Dollar, and Canadian Dollar (this last one in a very small way). The former two currencies gained in line with the news.
Apart from these directly influential data items, markets were also closely watching the Jackson Hole Symposium of central bankers, and tariffs and sanctions talk from the US Administration.
US/Canada Tariffs
Early in the week, the U.S. imposed 50% tariffs on C$27.6 billion of Canadian goods effective August 22. Canada responded with matching 15%, 25% and 50% counter-tariffs on the same value of U.S. imports, due to start September 8, while also announcing C$7.5 billion of business and worker support. This was bearish for the Canadian Dollar, which is already being dragged lower due to falling Crude Oil prices.
Jackson Hole Symposium
Jackson Hole was the dominant cross-asset catalyst because Chair Kevin Warsh effectively gave markets a clearer inflation-risk reaction function without restoring conventional forward guidance.
Warsh’s essential message was:
Inflation remains above the Fed’s fixed 2% PCE objective.
The economy and labor market remain resilient enough that broad financial conditions do not look restrictive.
The Fed’s focus should therefore be on price stability.
If policymakers are not confident that underlying inflation is moving clearly and quickly enough toward target, “we have work to do.”
He cited PCE inflation of 3.7% year-on-year and 4.1% over six months, a 4.1% unemployment rate, resilient consumption, strong capital expenditure and loose-looking credit conditions. That combination made his language unambiguously more hawkish than markets had expected, and according to the CME FedWatch tool, raised the chance of a September rate hike by the Fed to 57%. Markets are now expecting a hike of 0.25% next month, which has been bullish for the USD.
Finally, there were several bullish breakouts in agricultural commodities last week, that are worth examining, as being long of commodities in bullish trends has historically been a very profitable trading strategy.
Iran Sanctions
Markets will not be taking this very seriously, as it seems that the Strait of Hormuz is now operating effectively enough to allow for gradual declines in global crude oil prices as exporting resumes to an acceptable level, while the Iranians can export very little.
The USA has just announced a deal which gives it access to 65 billion barrels of Venezuelan oil which will probably help the downwards pressure on the price of crude oil and its derivatives.
The Week Ahead: Key Data and Events to Watch
Next week will see highly important data items. The coming week’s most important data points, in order of likely importance, are:
US Average Hourly Earnings
US Non-Farm Employment Change
Bank of Canada Policy Meeting
US ISM Manufacturing PMI data
Reserve Bank of New Zealand Policy Meeting
Australia GDP
USA Unemployment Rate
Canada Unemployment
Monday is a public holiday in the UK.
Monthly Forex Forecast: September 2026 Overview
For the month of August, I made no forecast.
For the month of September, I again make no forecast, as the US Dollar has no real long-term trend.
Weekly Forecast 31st August 2026
This week, I make no forecast, as there were no exceptional price movements last week.
Volatility was relatively low last week, with only 11% of the notable currency pairs and crosses moving by more than 1% in value. Next week’s volatility is likely to be higher.
You can trade these forecasts in a real or demo Forex brokerage account.
Technical Overview and Key Levels
Key Support and Resistance on Major FX Pairs
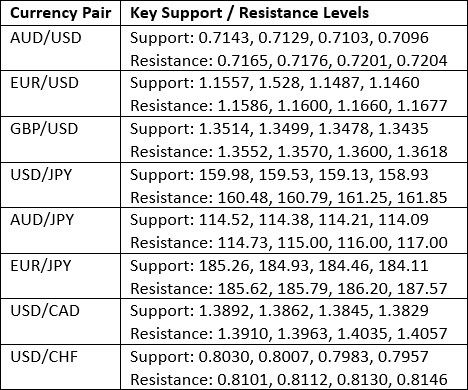
Key Support and Resistance Levels
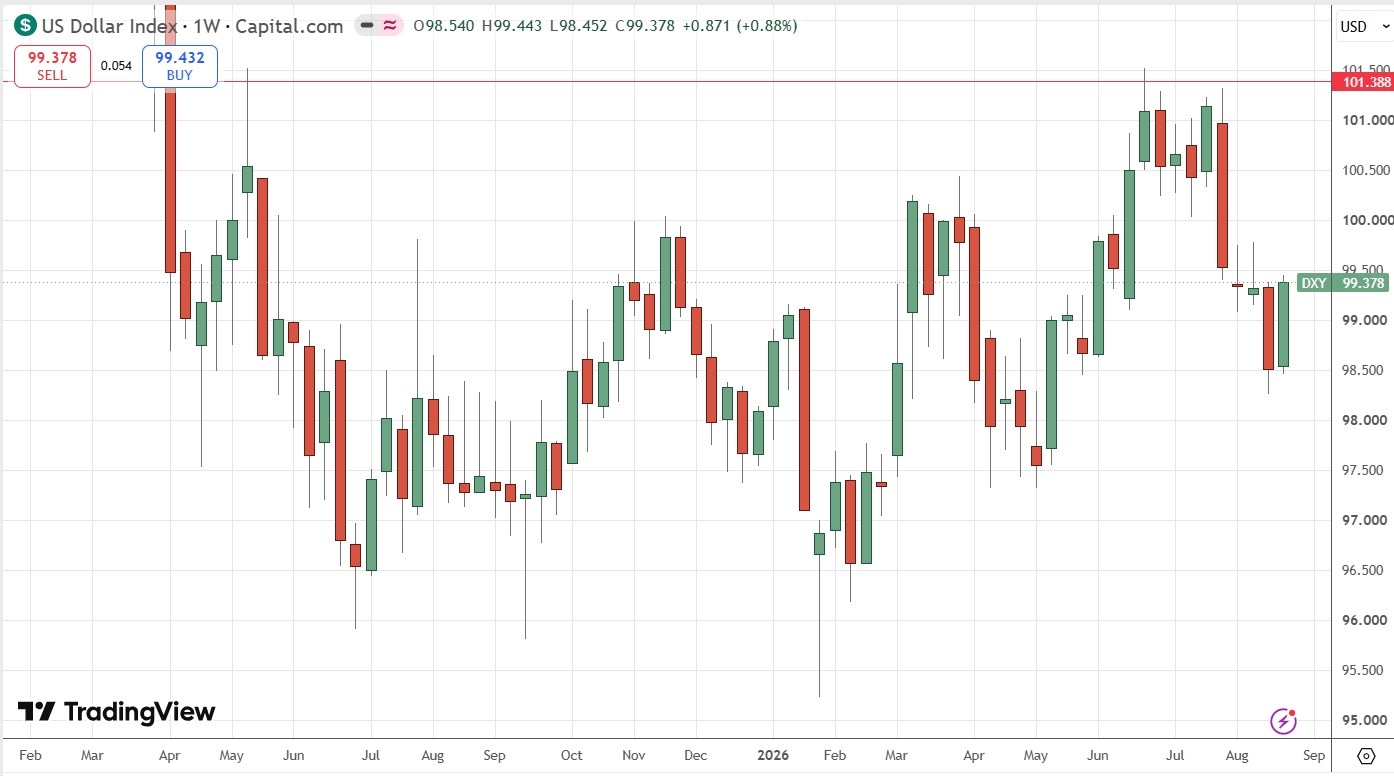
US Dollar Index
The US Dollar printed a relatively large bullish candlestick last week, closing not very far from its range high, and engulfing the real body of the previous week’s candlestick. These can be taken as bullish technical signs, but the weekly closing price was above its level of 3 months ago but not 6 months ago, indicating an indecisive long-term trend. It can be said we have seen a succession of higher lows over recent weeks, which would be a bullish sign.
I think that the Greenback is likely to keep a bit of a bid and rise higher, as new Fed Chair Warsh’s speech at the Jackson Hole symposium was clearly hawkish and shifted expectations of the Fed’s path going forward towards a more hawkish direction.
I am most comfortable being long of the US Dollar right now.
US Dollar Index Weekly Price Chart
GBP/USD
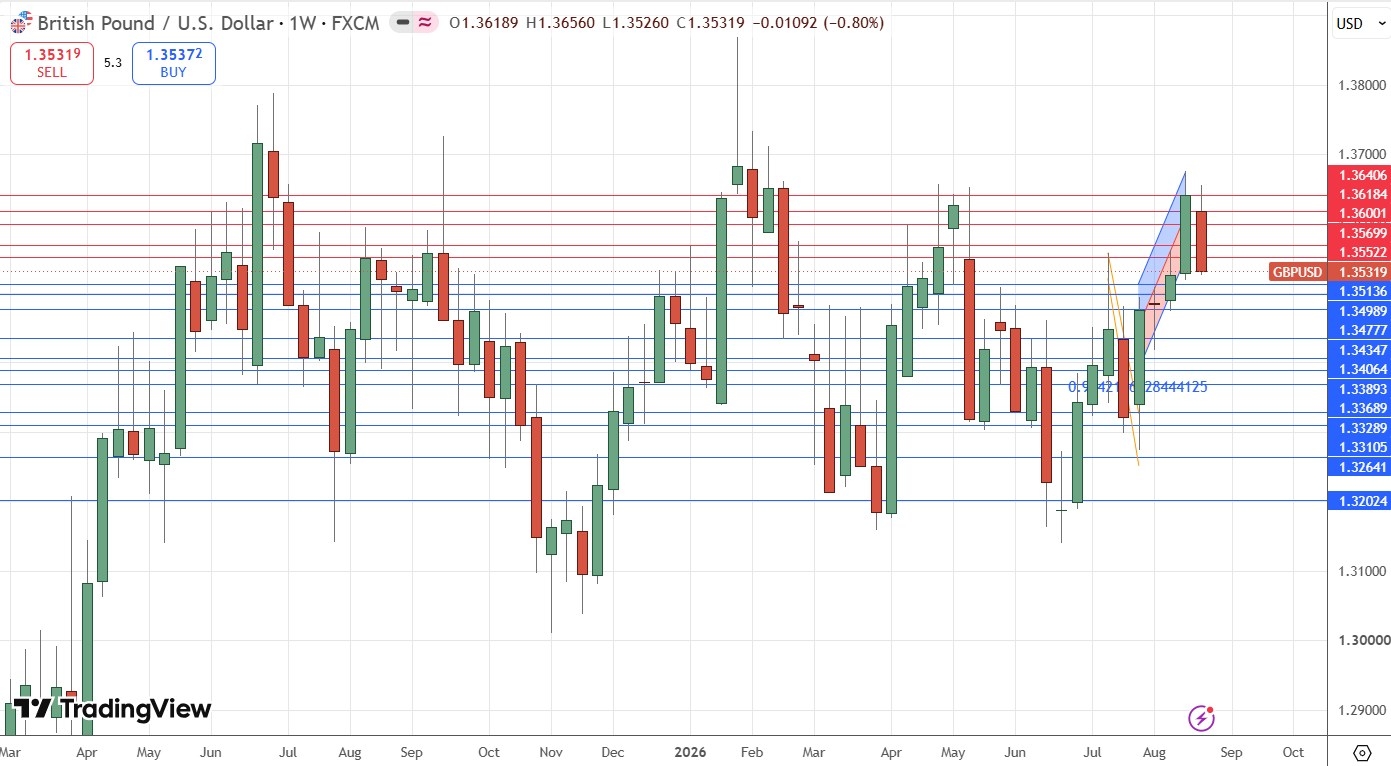
The GBP/USD currency pair tried to push to a new 6-month high last week, after making a few earlier bullish breakouts, but ultimately failed some pips short of the recent high, before finally turning more decisively bearish at the end of the week as the US Dollar got a strong boost from Jackson Hole.
Zooming out and looking at the long-term weekly price chart below, we can see that this might be interesting for two reasons. Firstly, the bearish rejection started right at the top of this very rectangular looking range, which suggests that beginning of a move down to the lower edge of this range at $1.3100 and maybe even below that. Secondly, note how there are two fairly equal “shoulders” each side of the high in the middle, which suggests that a bearish head and shoulders chart pattern is dominant again.
The British Pound has been relatively strong over recent months, but technically, this currency pair does seem primed for a move lower.
GBP/USD Weekly Price Chart
USD/CAD
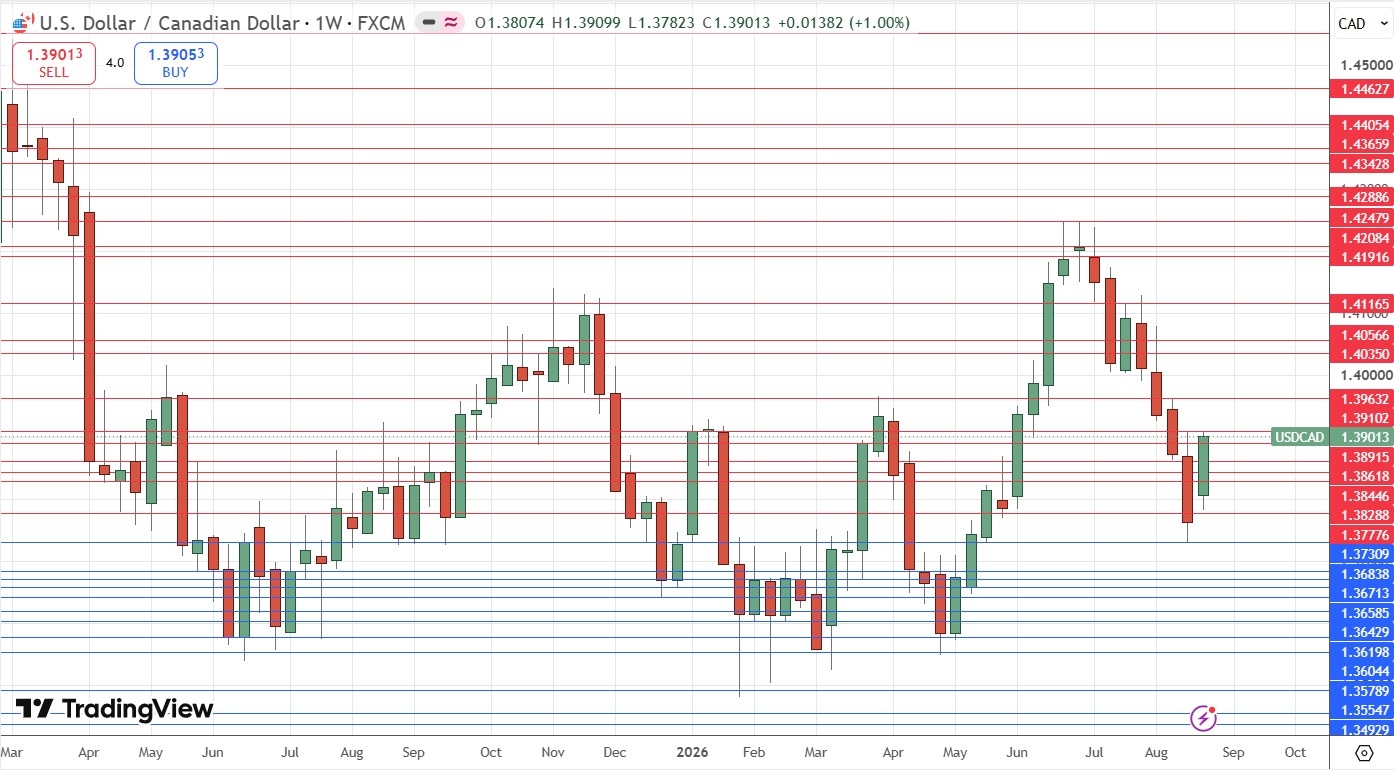
There was a strong bullish move in the USD/CAD currency pair last week. We have a clear bullish “V” chart pattern that indicates strong bullish momentum, which is backed by the fact that the candlestick closed near the top of its weekly range.
What we saw last week was this currency pair at the centre of attention, because the Canadian Dollar was weak from being hit by the new US tariffs and falling Crude Oil prices, while the US Dollar strengthened due to Fed Chair Warsh’s hawkish speech at the Jackson Hole Symposium.
Despite these bullish factors, the price action in the chart shows there is not much of a bullish trend here – or at least, if this is the first significant higher low of a new bullish trend, it has been a very deep retracement.
There is likely some more bullish momentum due here, but how much, that would be guessing. In any case, anyone who wants to day trade Forex during the early part of the coming week during the New York session might want to look for long trade opportunities in this currency pair.
USD/CAD Weekly Price Chart
Sugar Futures
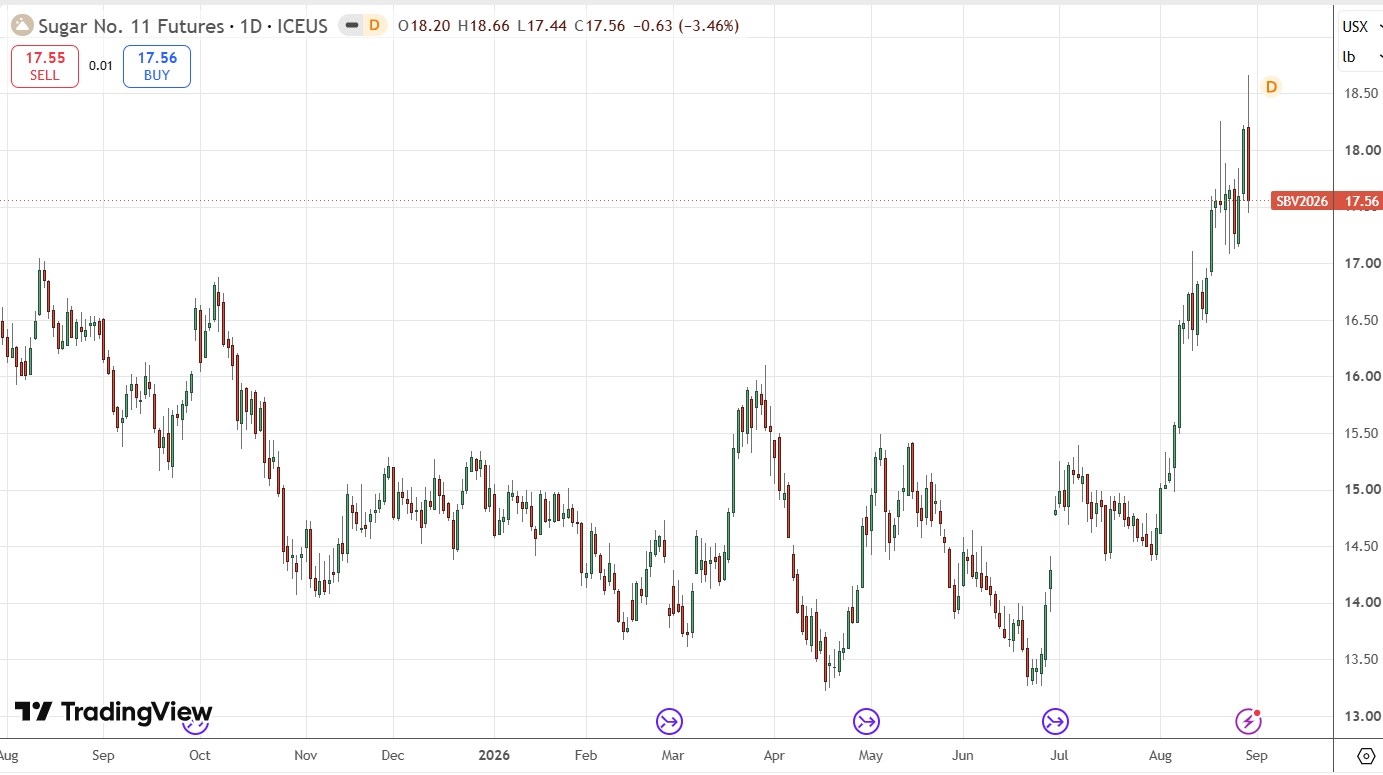
Sugar futures rose over most of last week after exploding higher over the past month, but fell back sharply after reaching a new 1-year high on Friday to trade lower and form a daily candlestick which is a bearish engulfing and outside candlestick, signaling a possibly significant bearish reversal.
The recent price action does not rule out a move higher, but for anyone already in the trade it is a signal to think about where an exit should be. I say that if the price closes below 16.75 it is time to get out – the area around 17.00 looks like clear resistance flipped to support, so it would be meaningful if this price area does not hold up with it is next tested from above.
This trade might still have legs, but if you are not already long here, it might be wise to either use a tighter stop, or wait for a new daily closing price which is also a 1-year high.
Sugar Futures Daily Price Chart
Wheat Futures
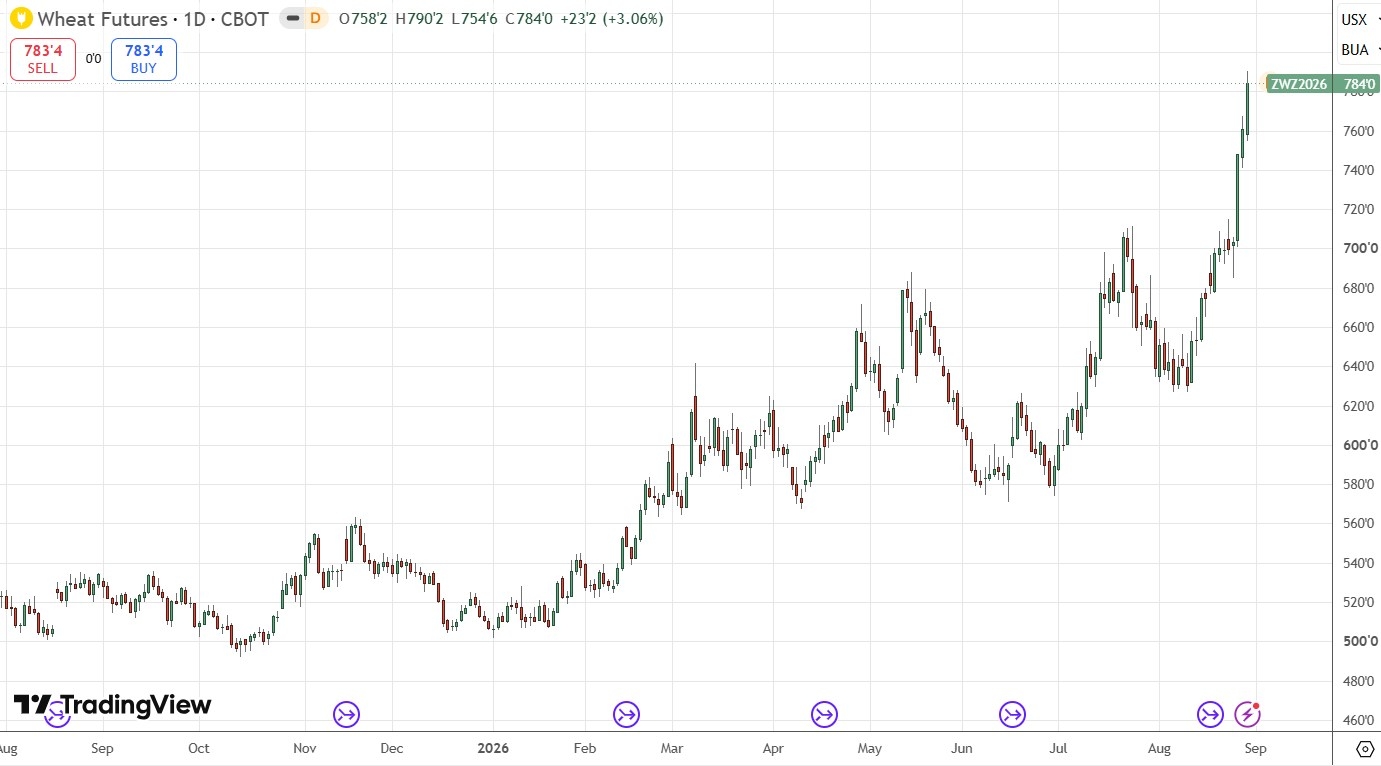
Wheat Futures made an extremely bullish breakout last week, rising forcefully to end the week at a new 3.5-year high price. The size of the daily candlestick at Wednesday’s breakout was huge, and we saw good bullish follow through over the last two days of the week, so if you had entered on Wednesday you would already be sitting firmly in profit.
This looks like an exciting long trend trade where it is just a question of holding on until a consistent trailing stop (ideally based upon volatility) takes you out.
If you have not entered this trade yet then it is worth considering, because being long of commodities at long-term bullish breakouts has historically been a very profitable trading strategy. It might be wise to control risk by entering with half the normal position size, as the move might be very over-extended.
The price of Wheat has begun rising very strongly as markets have started to price in Black Sea disruption due to the Russia/Ukraine war. About one quarter of the world’s Wheat supply is exported by Russia and Ukraine.
If Wheat futures are too big for you, consider an alternative ETF like WEAT which is much more affordable.
Wheat Futures Daily Price Chart
Soybean Futures
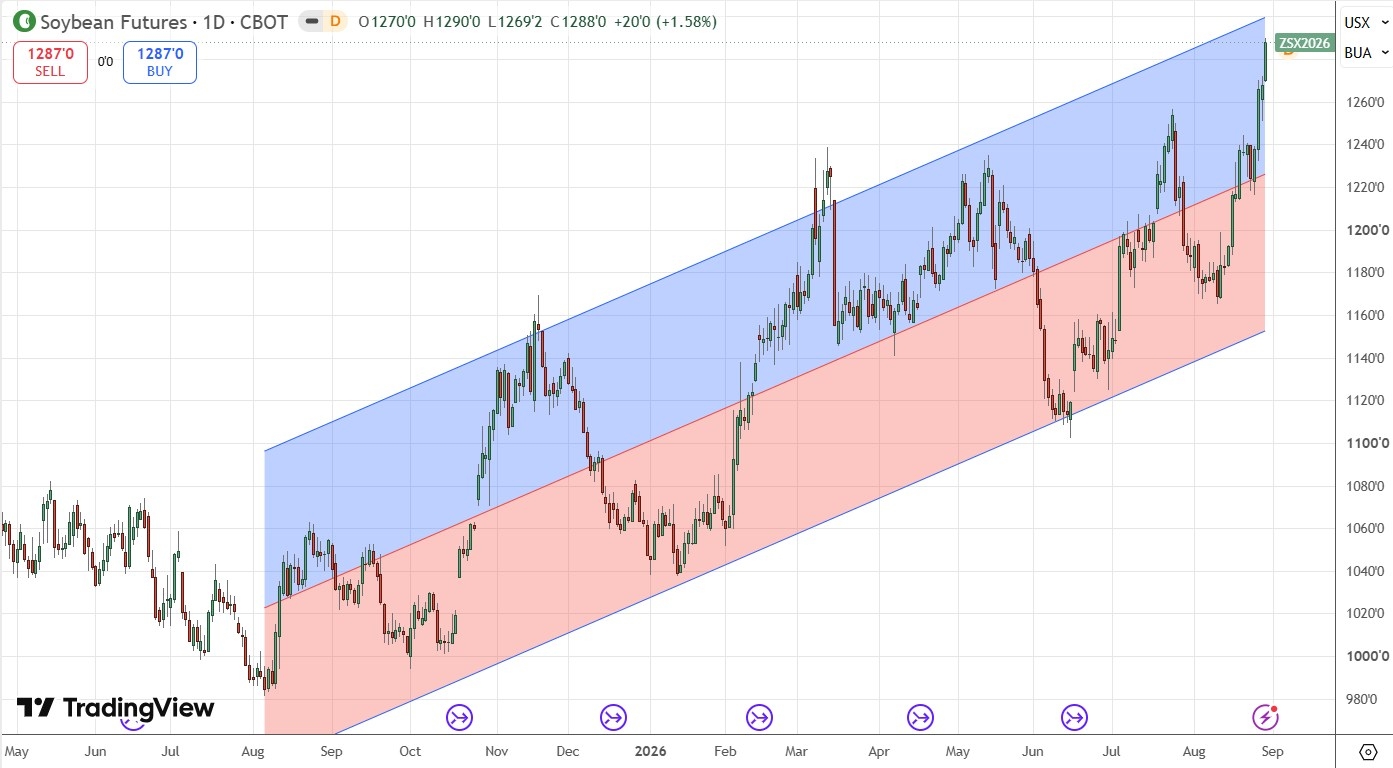
Soybean Futures made a very strong bullish breakout last week, rising forcefully to end the week at a new 2.5-year high price. The size of the daily candlestick at Wednesday’s breakout was large, and we saw good bullish follow through over the last two days of the week, so if you had entered on Wednesday you would already be sitting firmly in profit.
This looks like an exciting long trend trade where it is just a question of holding on until a consistent trailing stop (ideally based upon volatility) takes you out.
There are signs that this trend could be unusually reliable, as for several months the price action has been almost completely held by ascending price channel drawn via the linear regression anlaysis study visible in the price chart below.
If you have not entered this trade yet then it is worth considering, because being long of commodities at long-term bullish breakouts has historically been a very profitable trading strategy. It might be wise to control risk by entering with half the normal position size, as the move might be very over-extended.
The price of Soybeans has begun rising strongly as markets have started to price in Black Sea disruption due to the Russia/Ukraine war but even more importantly, stronger Chinese buying plus late-season crop risk.
If Soybean futures are too big for you, consider an alternative ETF like SOYB which is much more affordable.
Soybean Futures Daily Price Chart
WTI Crude Oil
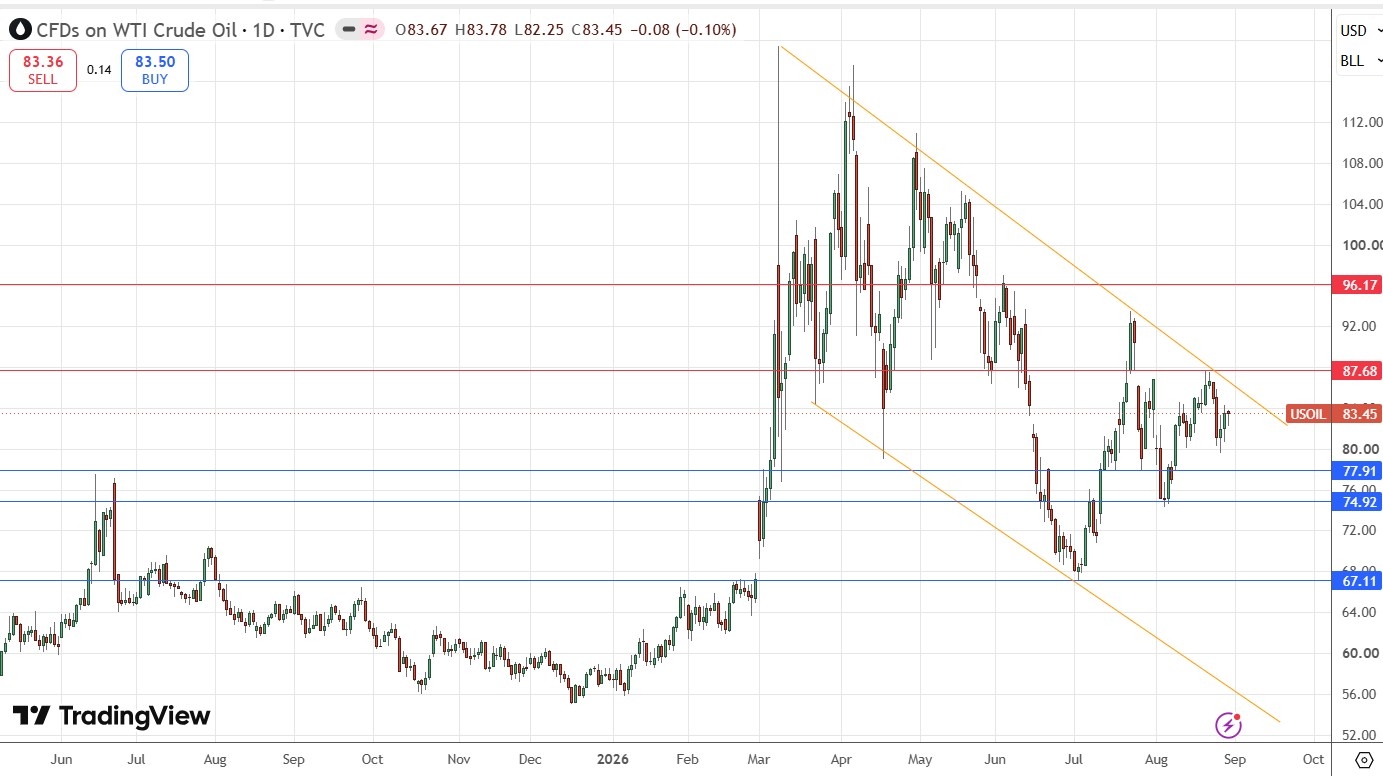
WTI Crude Oil is starting to show a very interesting technical feature in its daily chart below – a symmetrical descending price channel which also looks like a bullish flag! Yet I think iti s more of a descent than flag.
Despite the fighting words from Tehran, it is becoming clear that the USA has effectively neutralized the true bite of Iran’s Strait of Hormuz closure weapon – the USA has reached a point where sufficient oil is being successfully exported from that Gulf to prevent the price from becoming overly elevated. The descending trend lines are where we see the general downwards trend manifesting since the start of the USA – Israel – Iran war at the end of last February.
Due to the technical formation and the confluence of the upper trend line and horizontal resistance level at $86.68, this level starts to look very pivotal for the coming week, potentially signaling a short trade if it continues to hold, or a long trade if the price gets established above it. On the other hand, I would not be comfortable with a long trade unless the Iranians are able to pull some kind of major surprise at the Strait of Hormuz soon. With President Pezeshkian openly calling for a formal end to the war, that looks unlikely to happen. With the US administration’s new round of unprecedentedly strong sanctions against anything facilitating trade with Tehran, I expect the price of Crude Oil to sink a bit further.
WTI Crude Oil is likely to be more interesting to day traders than to anyone else.
WTI Crude Oil Spot Daily Price Chart
Ethereum
The crypto sector has been on a roll ever since the US Treasury started supporting the long end of the bond market a couple of weeks ago. We can now add to that a short squeeze, institutional ETF purchases, and generally easier financial conditions, although the hawkish tilt the Fed seems to be taking now might put a dampener on that.
In any case, we have seen major cryptos rise strongly and reach new highs. Usually such rallies are led by Bitcoin, but this time, Ethereum is the one that looks most interesting as a potential long trade, as its moving averages support the bullish case better and the impending breakout looks more dramatic.
The daily Ethereum price chart below shows how the pair shot up and then for the past few days, traded in a fairly tight but very even range. This looks like a temporary bullish consolidation that will be broken to the upside.
I will be happy to take a long trend trade of Ethereum if we get a daily close above the $2,515 level (note also how the major quarter-number at $2,500 has acted as resistance, potentially reinforcing the significance of the current consolidation.
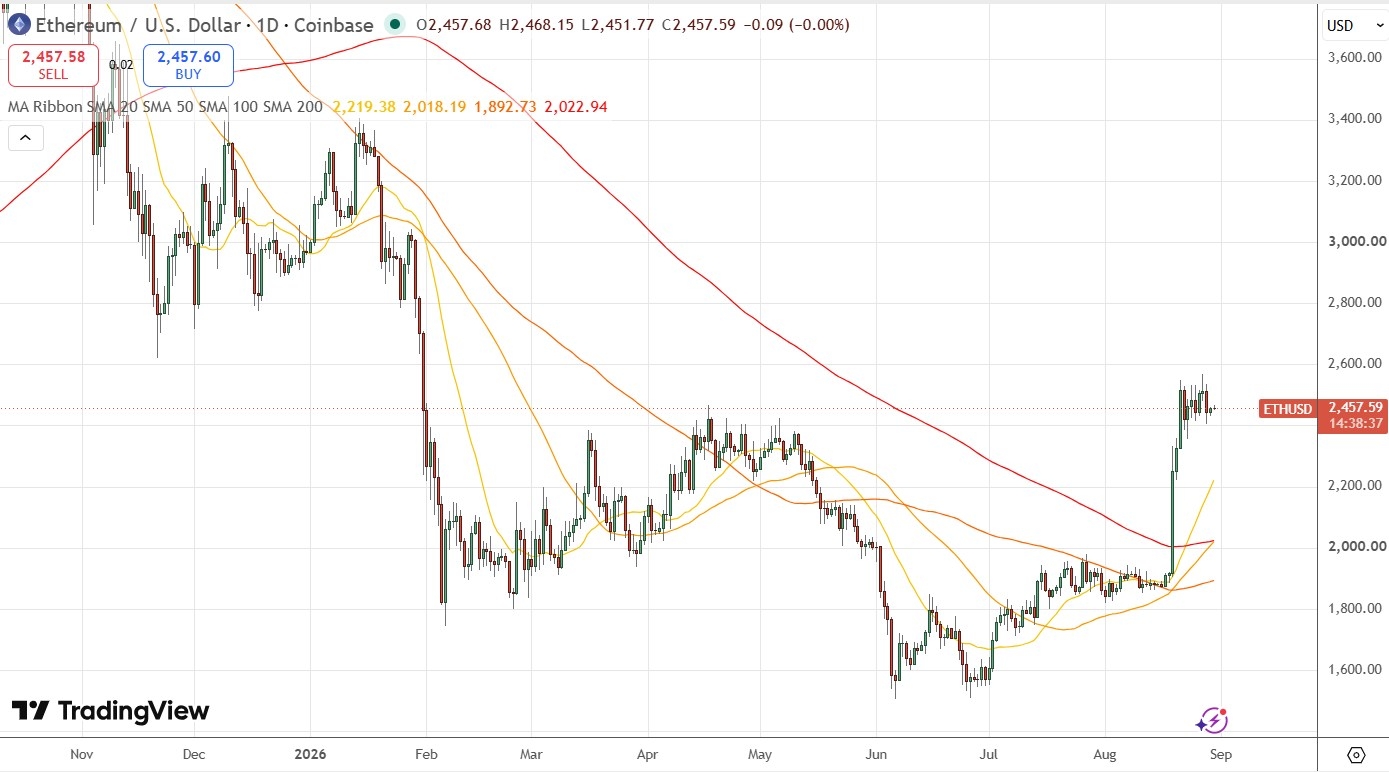
Ethereum Daily Price Chart
Bottom Line
I see the best trades this week as:
Long of Sugar.
Long of Wheat.
Long of Soybeans.
Long of Ethereum following a daily close above $2,515.
Ready to trade our Weekly Forex forecast? Check out our list of the best Forex brokers.