


Top Regulated Brokers
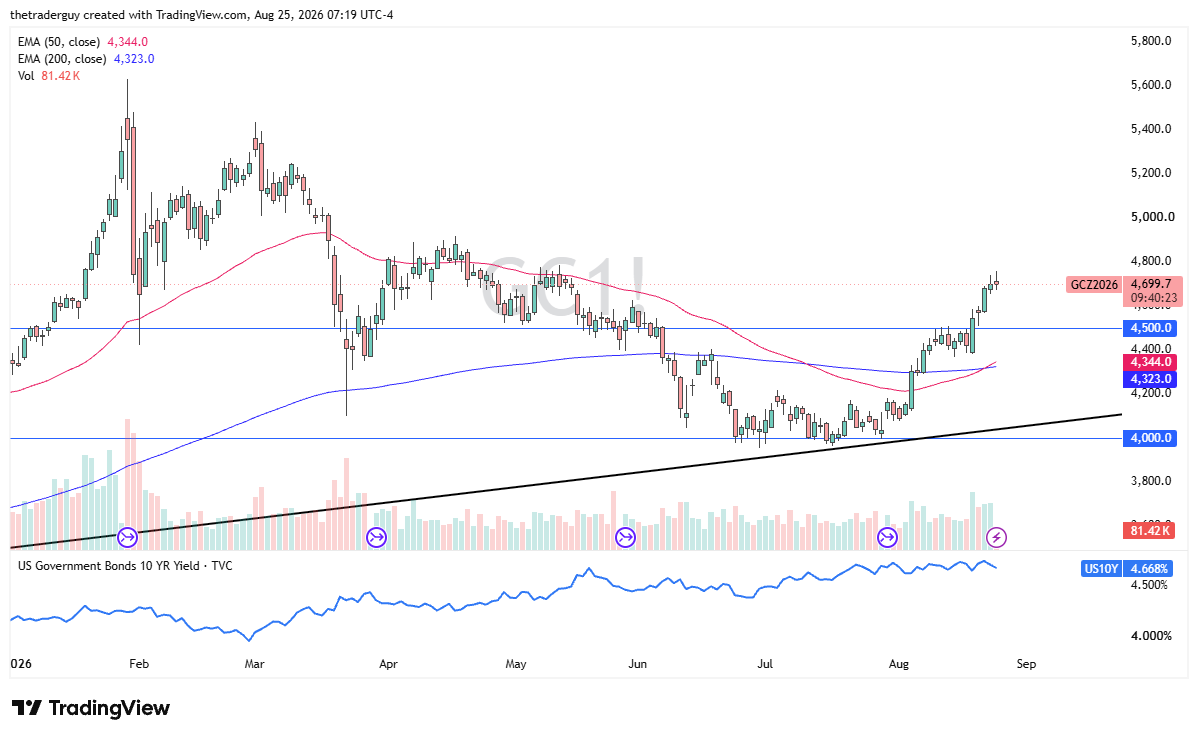
Institutional demand has systematically defended gold at each lower test, suggesting a structural shift in how capital interprets US fiscal and monetary divergence. The Golden Cross formation (a 50-day EMA break above the 200-day EMA) exposes the mismatch between market pricing and the actual trajectory of real yields, where Treasury long-end compression and geopolitical friction are creating genuine asymmetry in how traders assess terminal rate assumptions.
Market Context: Why Gold's Structural Support Matters Now
The $4,700 resistance zone has emerged as the pivot that separates two competing narratives: one in which Fed rate expectations remain anchored to terminal tightening, and another where fiscal pressure and real yield compression force a structural repricing of long-duration assets. Treasury buyback flows into the long end, combined with fading odds of additional rate hikes, are creating the technical scaffold for the Golden Cross signal. Geopolitical friction, particularly Iran sanctions escalation and ongoing China trade uncertainty, provides the macro permission structure that allows Gold to break higher without triggering the typical reversal mechanics.
The Golden Cross Divergence: Momentum vs. Sentiment
The Golden Cross divergence exposes a structural mismatch in how different investor cohorts are pricing terminal rates and real yield trajectories. Institutional positioning has rotated toward longer-dated hedges precisely as retail enthusiasm has returned to gold on the back of technical breakouts. This mirrors a pattern seen in prior real yield compressions: the technical signal arrives after the smart money has already positioned, leaving momentum players vulnerable to reversals once the initial wave of follow-through buying exhausts. The 50-day EMA breakout above the 200-day EMA indicates commitment, but the subsequent consolidation between $4,500 and $4,800 suggests that conviction is being tested rather than confirmed.
Gold Price Chart
Geopolitical Friction and the Real Yield Narrative
Geopolitical headlines provide surface-level justification for gold's recent moves, but the underlying mechanism sits in real yield dynamics. Iran sanctions, Canada trade friction, and China tariff escalation all serve the same function: they provide permission for risk-off rotations without requiring a specific macroeconomic deterioration trigger. Real yields have compressed from their highs, but the trajectory remains fragile. Should inflation data surprise to the upside, particularly next week's PCE print, the narrative would flip instantly, and the geopolitical risk premium would evaporate in favor of a Fed rate expectations reassertion. This binary outcome suggests that gold's current setup is conditioned on a specific inflation outcome, not on geopolitical escalation alone.
The Consensus Blind Spot: When Technical Signals Mask Vulnerability
The Golden Cross signal masks a critical vulnerability that most market participants are overlooking: retail enthusiasm has returned to gold precisely when institutional positioning is most susceptible to reversal mechanics. The technical setup is valid, but validity and profitability are not the same condition. Traders are fixating on the geopolitical backdrop and real yield compression narrative, but they are underestimating the extent to which this setup has already been priced into positioning. When consensus aligns too tightly around a single driver—in this case, real yield compression as the permanent tailwind—the market becomes vulnerable to a whipsaw when that driver loses momentum. The next inflation surprise, whether to the upside or downside, will reveal whether the technical setup is driven by genuine structural change or merely by short-term positioning rotation. That distinction determines whether gold consolidates or reverses.
Technical Invalidation and Support Zones
The invalidation threshold is explicit: a decisive daily close below $4,500 would breach the critical support zone and open exposure to the $4,000 longer-term floor. At that point, the Golden Cross signal would be invalidated, and momentum players would be forced to exit. The $4,800 ceiling, meanwhile, has demonstrated stickiness in recent sessions, suggesting that institutional sellers are defending that level aggressively. A break above $4,800 on a daily close would reposition the commodity for a run toward $5,000, but only if volume accompanies the breakout. Current consolidation suggests that conviction is being tested, not confirmed, making the $4,500 to $4,800 band the critical battleground.
The Golden Cross divergence reflects genuine compression in real yields and structural rotation toward duration hedges, but the signal arrives late enough in the cycle that initial momentum is already being tested. The $4,800 ceiling has proven sticky, invalidation remains defined at $4,500, and the thesis hinges entirely on next week's PCE print and inflation trajectory. Watch for any technical flush below $4,600 in the London morning session Wednesday, and monitor whether the $4,500 support holds: that level will determine whether the bullish structure consolidates or fractures.
Ready to trade our Gold analysis? Here is our list of the best Gold brokers worth reviewing.