


Bullish view
Buy the GBP/USD pair and set a take-profit at 1.3800.
Add a stop-loss at 1.3550.
Timeline: 1-3 days.
Bearish view
Sell the GBP/USD pair and set a take-profit at 1.3550.
Add a stop-loss at 1.3800.
Top Regulated Brokers
The GBP/USD exchange rate wavered near its highest level this month after the US released weak consumer confidence and housing data. It was trading at 1.3645, up sharply from the August low of 1.3275 as focus shifts to the upcoming US PCE and GDP numbers later today.
US PCE and GDP Data Ahead
The GBP/USD pair wavered as investors reacted to several important macro numbers from the United States. A report by the Conference Board showed that consumer confidence dropped to 89.4 in August from 90.2 a month earlier.
This decline was lower than the median estimate of 90.3, with consumers citing elevated inflation and troubles in the labor market. These numbers mean that the US economy may come under pressure since its spending is the biggest part of GDP.
More data showed that new home sales dropped by 10% in July to 607k, while the house price index rose 2.3% YoY, lower than the expected 2.4%
The next important catalyst for the GBP/USD pair will be the upcoming US inflation and GDP report. Economists expect this report to show that core and headline personal consumption expenditure (PCE) rose 3.3% YoY and 3.6%, respectively in July.
If these numbers are accurate, they will mean that inflation has remained above the Federal Reserve’s target of 2.0%. As a result, there is a likelihood that the bank will maintain a relatively hawkish tone this year since inflation has remained above the 2% target in the past few months.
The pair will also react to the upcoming US GDP report and Kevin Warsh’s statement at the Jackson Hole Symposium.
GBP/USD Technical Analysis
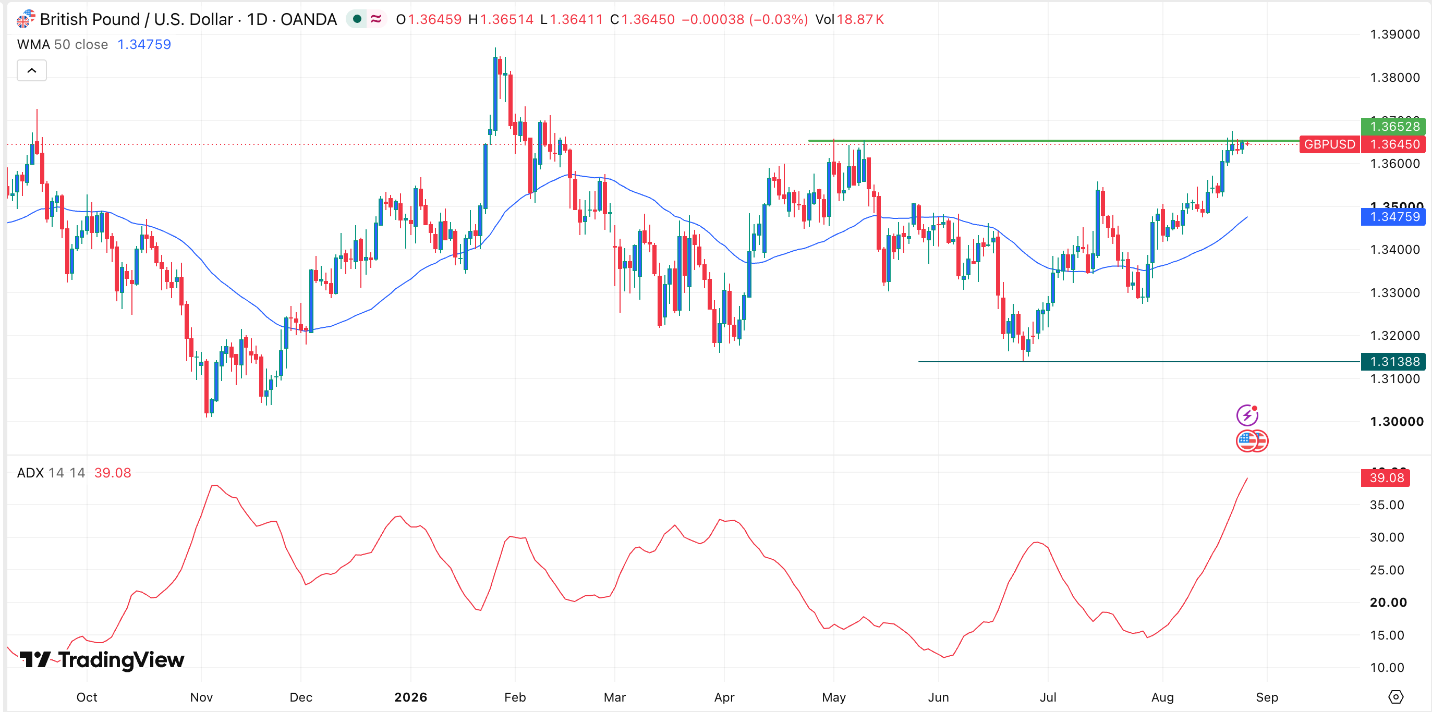
The daily chart shows that the GBP/USD pair has been in a strong uptrend in the past few months. It has jumped from the June low of 1.3138 to the current 1.3645. This price is notable because it aligns with the highest point in May this year.
The pair has formed an inverted head-and-shoulders pattern, a common bullish reversal sign in technical analysis. It has already formed a golden cross pattern, which happens when the 50-day and 200-day Weighted Moving Averages (WMA) cross each other.
The Average Directional Index (ADX) has jumped to 39, its highest level in months, and a sign that it is gaining momentum. Therefore, the pair will likely continue rising as bulls target the psychological level of 1.13800.
Ready to trade our GBP/USD analysis? Here is our list of the best Forex brokers worth reviewing.