


Bearish view
Sell the BTC/USD pair and set a take-profit at 60,000.
Add a stop-loss at 67,000.
Timeline: 1-2 days.
Bullish view
Buy the BTC/USD pair and set a take-profit at 67,000.
Add a stop-loss at 60,000.
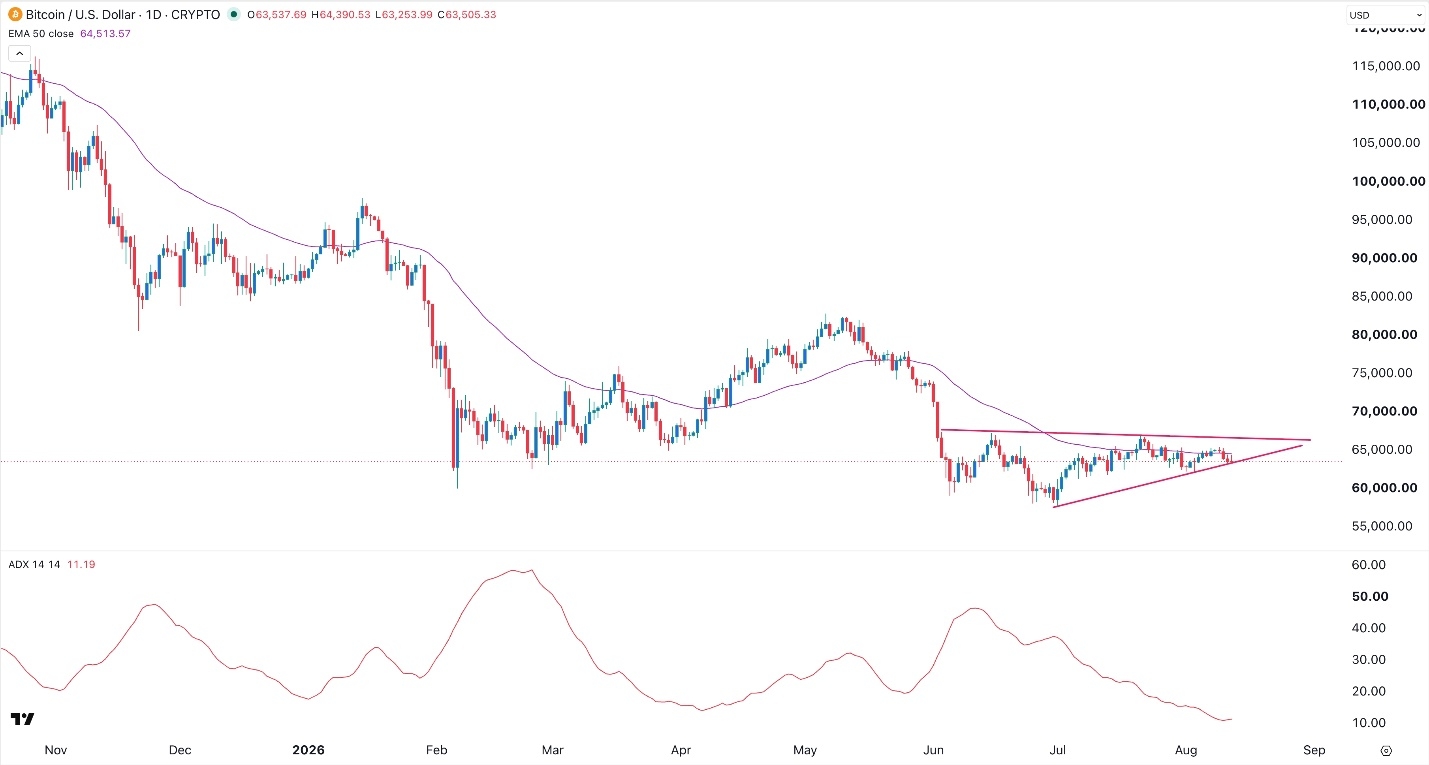
Bitcoin price slipped for the past four straight days as concerns about the ongoing ETF outflows and the falling odds that the CLARITY Act will be signed into law this year. The BTC/USD pair was trading at 63,400, down from this month’s high of 65,330.
Bitcoin has wavered this month as demand for spot Bitcoin ETFs waned. Data shows that these funds have shed over $100 million in assets this week, a big reversal after they added $853 million in assets last week. ETF inflows are usually a sign that demand is rising among institutional and retail investors.
Top Regulated Brokers
Bitcoin has also struggled after Strategy paused buying BTC and started selling. It sold coins worth over $108 million last week, continuing a trend that it started last month when the value of its preferred shares dropped. The company hopes to restart its Bitcoin buying later this year.
Other top Bitcoin holders have started selling their coins to fund their AI pivot. This includes Bitcoin mining companies like MARA Holdings and Riot Platforms. This selling will likely continue as they take advantage of the AI boom.
Bitcoin wavered even after the US published an encouraging consumer inflation report. Data showed that the headline CPI dropped slightly to 3.4%, while the core CPI moved downwards to 2.4%. These numbers mean that the Federal Reserve will not hike interest rates this year since last week’s nonfarm payrolls report came short of expectations.
BTC/USD Technical Analysis
The daily chart shows that the BTC/USD pair remains under pressure this week. It has moved slightly below the 50-day Exponential Moving Average (EMA). at the same time, the pair remains below the descending trendline that links the highest swings since June 15 this year.
The Relative Strength Index (RSI) has continued moving downwards in the past few days. Therefore, the most likely Bitcoin price forecast is bearish, with the next target to watch being at 60,000. A drop below that level will point to further downside, potentially to 57,500. On the other hand, a move above the resistance level of 66,000 will point to more upside in the coming weeks.
Ready to trade our free Forex signals? Here are the best MT4 crypto brokers to choose from