


Bullish view
Buy the BTC/USD pair and set a take-profit at 67,000.
Add a stop-loss at 60,000.
Timeline: 1-2 days.
Bearish view
Sell the BTC/USD pair and set a take-profit at 60,000.
Add a stop-loss at 67,000.
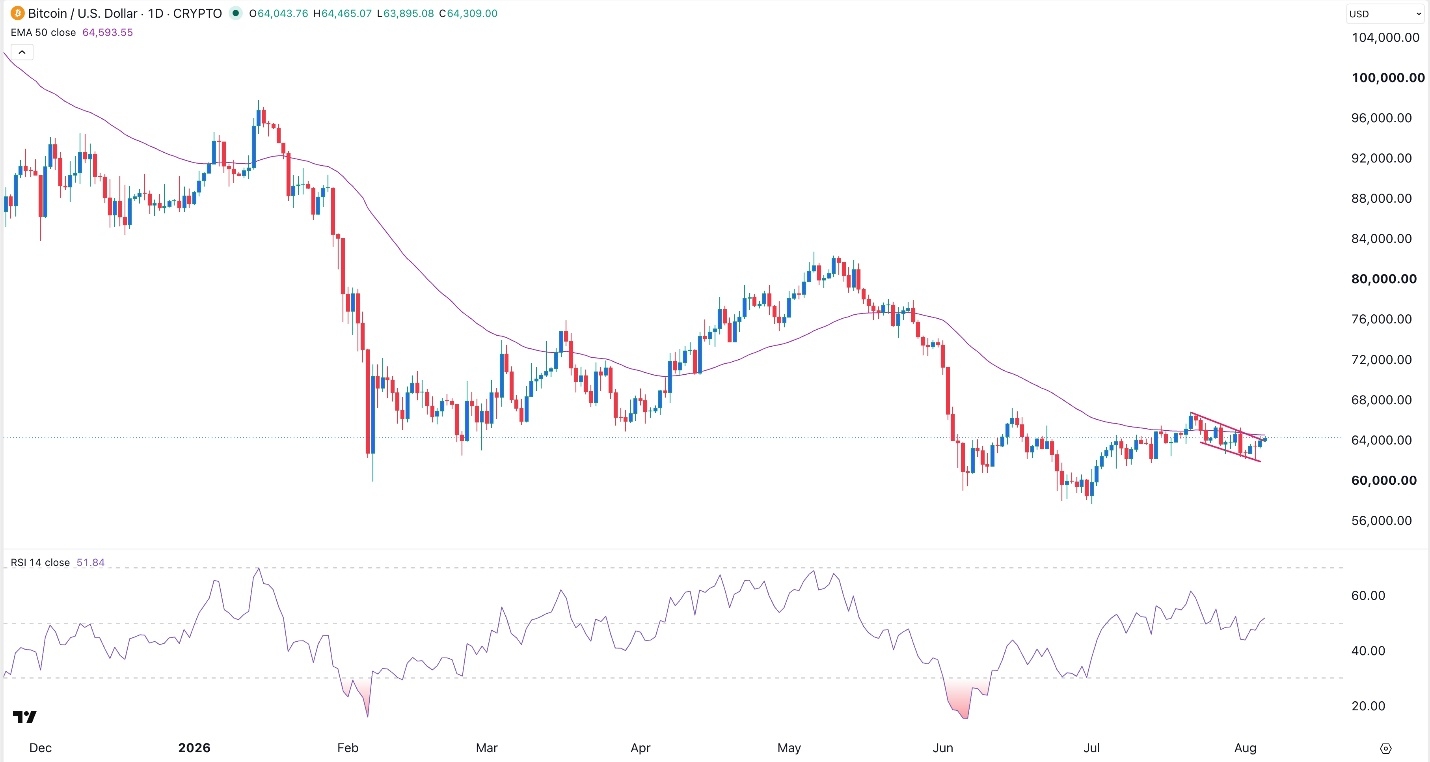
The BTC/USD pair rose slightly and crossed the important resistance of 64,000 as risky assets continued their slow recovery. Bitcoin has risen slightly from last week’s low of $62,148, helped by the rising ETF inflows and the potential that the CLARITY Act will get a pre-recess vote.
Top Regulated Brokers
Bitcoin Crawls Back as Risk-On Sentiment Prevails
The BTC/USD pair rose as most risky assets surged. In the US, top indices like the Dow Jones, Nasdaq 100, and S&P 500 jumped by over 1%, reaching their highest level on record. They have all risen by double digits from their January open.
The rally was triggered by an interview that Scott Bessent, the Treasury Secretary did with CNBC. In it, he maintained that talks were ongoing to reopen the Strait of Hormuz, confirming what the media reported earlier on.
These talks involve Iran and Oman, who are deliberating how ships will transit through the narrow strait. They also involve the transit fees that they will need to pay and how it will be shared.
That report pushed crude oil substantially low, with Brent and the West Texas Intermediate (WTI) falling below $80. This is notable as Brent retested the key resistance of $100 in July as tensions between the two countries escalated.
Falling oil prices is a bullish thing for Bitcoin and other risky assets because it reduces the odds that inflation will continue rising. It also reduces the probability that the Fed will hike interest rates.
The BTC/USD pair also rose slightly as spot Bitcoin ETF inflows continued. After gaining over $170 million on Monday, these funds added over $150 million in assets on Tuesday. Also, there are rising hope that the Senate will vote for the popular CLARITY Act before it moves for the recess.
BTC/USD Technical Analysis
The daily chart shows that the BTC/USD pair has crawled back in the past few days, moving from this month’s low of 62,148 to 64,095. It is now attempting to jump above the 25-day Exponential Moving Average (EMA).
At the same time, the Relative Strength Index (RSI) has risen and moved to 50, while the Average Directional Index (ADX) has dropped to 14, a sign that the trend is still weak. Therefore, Bitcoin will likely remain in this range in the coming days. A move above the key resistance at 65,000 will confirm the bullish outlook.
Ready to trade our free daily Forex trading signals? We’ve shortlisted the best MT4 crypto brokers in the industry for you.