


Bearish view
Sell the BTC/USD pair and set a take-profit at 72,000.
Add a stop-loss at 83,000.
Timeline: 1-2 days.
Bullish view
Buy the BTC/USD pair and set a take-profit at 83,000.
Add a stop-loss at 72,000.
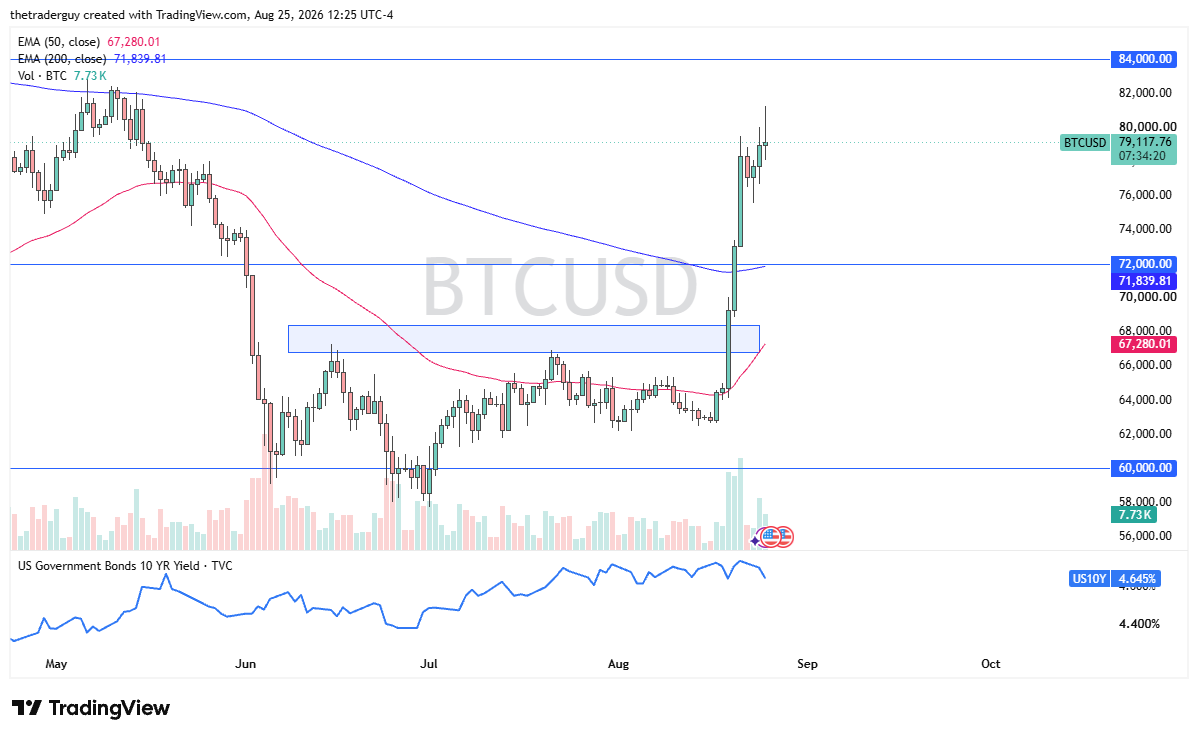
Bitcoin retreated slightly as the recent bullish momentum faded and as investors started to book profits. The BTC/USD pair dropped to 78,450 on Thursday, down from this month’s high of 81,233. It has formed a shooting star candle that may be a sign of a bearish reversal.
Top Regulated Brokers
Bitcoin Retreats Ahead of Jackson Hole Meeting
The BTC/USD pair wavered as traders started booking profits after the recent rally that pushed Bitcoin to its highest point since May. This retreat happened after the US released relatively strong inflation numbers. A report showed that the headline Personal Consumption Expenditure (PCE) rose 3.7% in July, higher than the expected 3.6%. Core PCE, which excludes the volatile food and energy, rose 3.3% during the month.
The coin is now waiting for the upcoming statement from Jerome Powell, the Federal Reserve Chair, at the Jackson Hole Symposium. This will be an important statement because it will shed more light on the future of interest rates. Signs that the bank will hike rates later this year will be bearish for the coin.
On the positive side, Bitcoin ETF inflows are doing well this year. They have added over $3 billion in assets this month, the best performance this year. This is a big increase as the funds added $172 million in assets last month. Rising ETF inflows is a sign that investors are starting to embrace coins as the volatility in the stock market rises.
BTC/USD Technical Analysis
The daily chart shows that the BTC/USD pair has pulled back in the past few weeks, moving from the month-to-date high of 81,233 to the current 78,400. It formed a shooting star candlestick pattern, which is characterized by a small body and long upper shadow. This pattern normally leads to more downside.
The Relative Strength Index (RSI) has moved from the overbought level of 82 to the current 78.9. That is a sign that the pair is moving into a profit-taking zone. Therefore, the most likely scenario is where the pair retreats in the near term, potentially to the key support level of 70,000. On the other hand, a move above the upper side of the shadow will point to more upside, potentially to the psychological point of 85,000.
Ready to trade our free Forex signals? Here are the best MT4 crypto brokers to choose from.