


Bitcoin's price chart looks unusually quiet these days, but quiet on the surface doesn't always mean quiet underneath. While the pair drifts sideways, something else has been stirring across the network: a wave of new wallets, renewed on-chain activity, and traders quietly repositioning their holdings.
It's the kind of divergence that tends to catch attention: rising participation paired with a market that refuses to move. Is this the calm before a breakout, or just noise from an unrelated security scare rippling through the ecosystem? The activity beneath the surface may end up being more telling than the price action itself.
The trigger appears to trace back to a security scare, not a market signal. Recent exploits tied to Coldcard hardware wallets have reportedly pushed some holders to move funds, create fresh wallets, and rotate custody setups altogether, according to on-chain analytics firm Santiment. That kind of defensive behavior tends to ripple through a network fast.
Santiment noted that polarizing events like this often produce the sharpest on-chain reactions for Bitcoin and altcoins alike, since fear and greed both push people to transact and pay closer attention. Analyst BitBelle echoed that read, noting that the timing lines up: the Coldcard situation is prompting more users to rethink custody and reposition funds, even as price itself stays subdued. In other words, the network may be reacting to a trust event rather than a price catalyst, which is why wallet counts and the chart are currently telling two different stories.
Top Regulated Brokers
Bitcoin Network Shows Strongest Wallet Growth in 12 Months
New wallet creation jumped to 2.27 million last week, the highest reading of the past year, according to Santiment. Daily active addresses climbed alongside it, reaching a ten-month high of 752,000, a sign that more participants are transacting rather than simply opening dormant accounts.
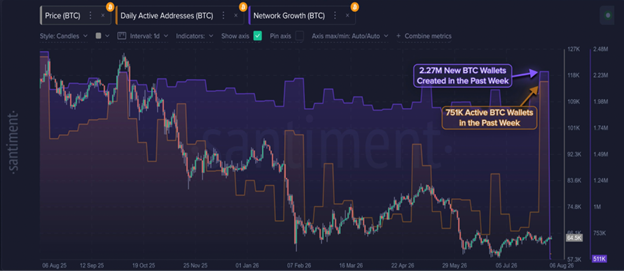
Bitcoin weekly active addresses and network growth. Source: Santiment
Santiment pointed out that when retail holders grow uneasy, larger Bitcoin stakeholders often use the resulting confusion to accumulate more aggressively. That pattern lines up with separate DailyForex on-chain data showing long-term holders adding roughly 380,000 BTC over the past month, even as price oscillated between $60,000 and $65,000, suggesting seasoned holders remain confident in a return toward record highs.
Analyst Lucky said the pickup doesn't automatically signal an imminent move higher, but "when you see new wallets coming in while active wallets are also picking up, it's hard to ignore." Historically, rising network usage paired with stronger-hand accumulation has preceded constructive price action in the weeks and months that followed.
None of this activity has translated into aggressive selling pressure, but it hasn't produced convincing buying pressure either. Exchange depositing transactions on Binance remain at relatively low levels, according to CryptoQuant analyst Rei Researcher, who noted that BTC deposit activity to exchanges "remains relatively stable rather than expanding significantly." That, the analyst added, isn't a bullish or bearish signal on its own; it simply suggests behavior hasn't shifted meaningfully in recent months.
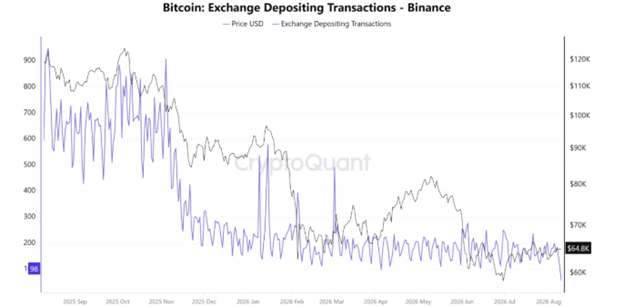
Bitcoin exchange depositing transactions. Source: CryptoQuant
The bigger blind spot may be assuming rising participation automatically favors higher prices. Bitcoin is still down 25% year-to-date and sits roughly 48.5% below its $126,000 all-time high reached in October 2025. A wave of wallet creation driven by a security scare says more about caution and repositioning than conviction, and conviction, not just activity, is usually what price needs to break out of a range.
Bitcoin Faces Stiff Resistance Above $65,000
Bitcoin's recent bounce off support has stalled almost exactly where chart watchers expected. After rallying from the low $60,000s, price ran into the $65,500-$68,000 zone, an area reinforced by the 100-day simple moving average.
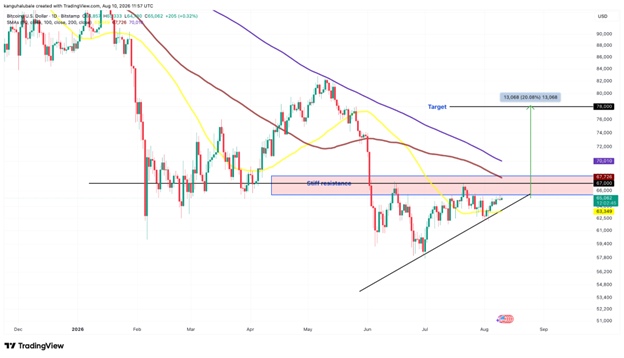
BTC/USD daily chart. Source: TradingView
Cost basis distribution data from Glassnode shows why that zone is proving sticky: roughly 675,200 BTC were acquired at an average price between $65,300 and $68,500, meaning a large cohort of holders sit near breakeven. That concentration raises the odds some investors sell simply to exit at cost, capping upside near-term. A second congestion band sits higher, between $69,000 and $70,100, where holders bought about 203,064 BTC, another potential ceiling if price gets that far.
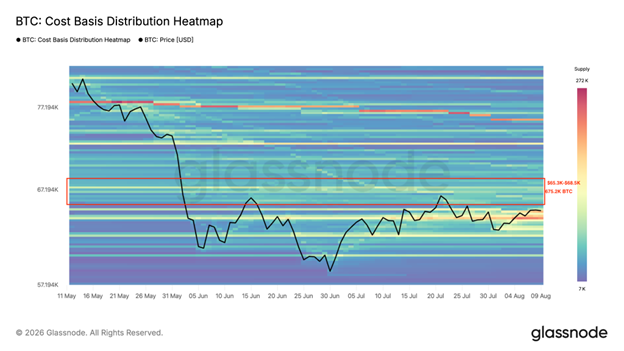
Bitcoin cost basis distribution chart. Source: Glassnode
That doesn't rule out a breakout. A daily close above the $69,000-$70,100 band would clear both congestion zones and open the path toward the measured target of the ascending triangle near $78,000, roughly 20% above current levels. For that to happen, buyers would need to absorb the supply sitting at breakeven rather than being met with steady selling into strength. Until that shift shows up on the chart, the resistance zone looks like the more likely outcome than a clean breakout.
Whether the recent wallet growth marks the start of renewed conviction or simply reflects a temporary reaction to a security scare should become clearer in the sessions ahead. Watch whether daily active addresses hold their gains once the Coldcard story fades, and whether price can finally close above the $65,500-$68,000 zone that has capped it for weeks. Both would say more about Bitcoin's next move than the wallet count alone.
Ready to trade our analysis of Bitcoin? Here’s our list of the best MT4 crypto brokers worth checking out.