


Bitcoin’s (BTC) recent price action is leaving traders with fewer reasons to dismiss the possibility of another leg lower. After consolidating within the $60,000-$65,000 for the last two months, BTC has weakened around a long-term technical pivot, while liquidity beneath the price is becoming increasingly important to the short-term structure.
The key question is no longer simply whether Bitcoin can bounce, but where forced selling and resting orders could attract price if sellers retain control. With traders increasingly focused on the $60,000 area, the market is approaching a level where technical structure, derivatives positioning and institutional flows could begin reinforcing one another.
Bitcoin’s Technical Structure Keeps $60,000 in Focus
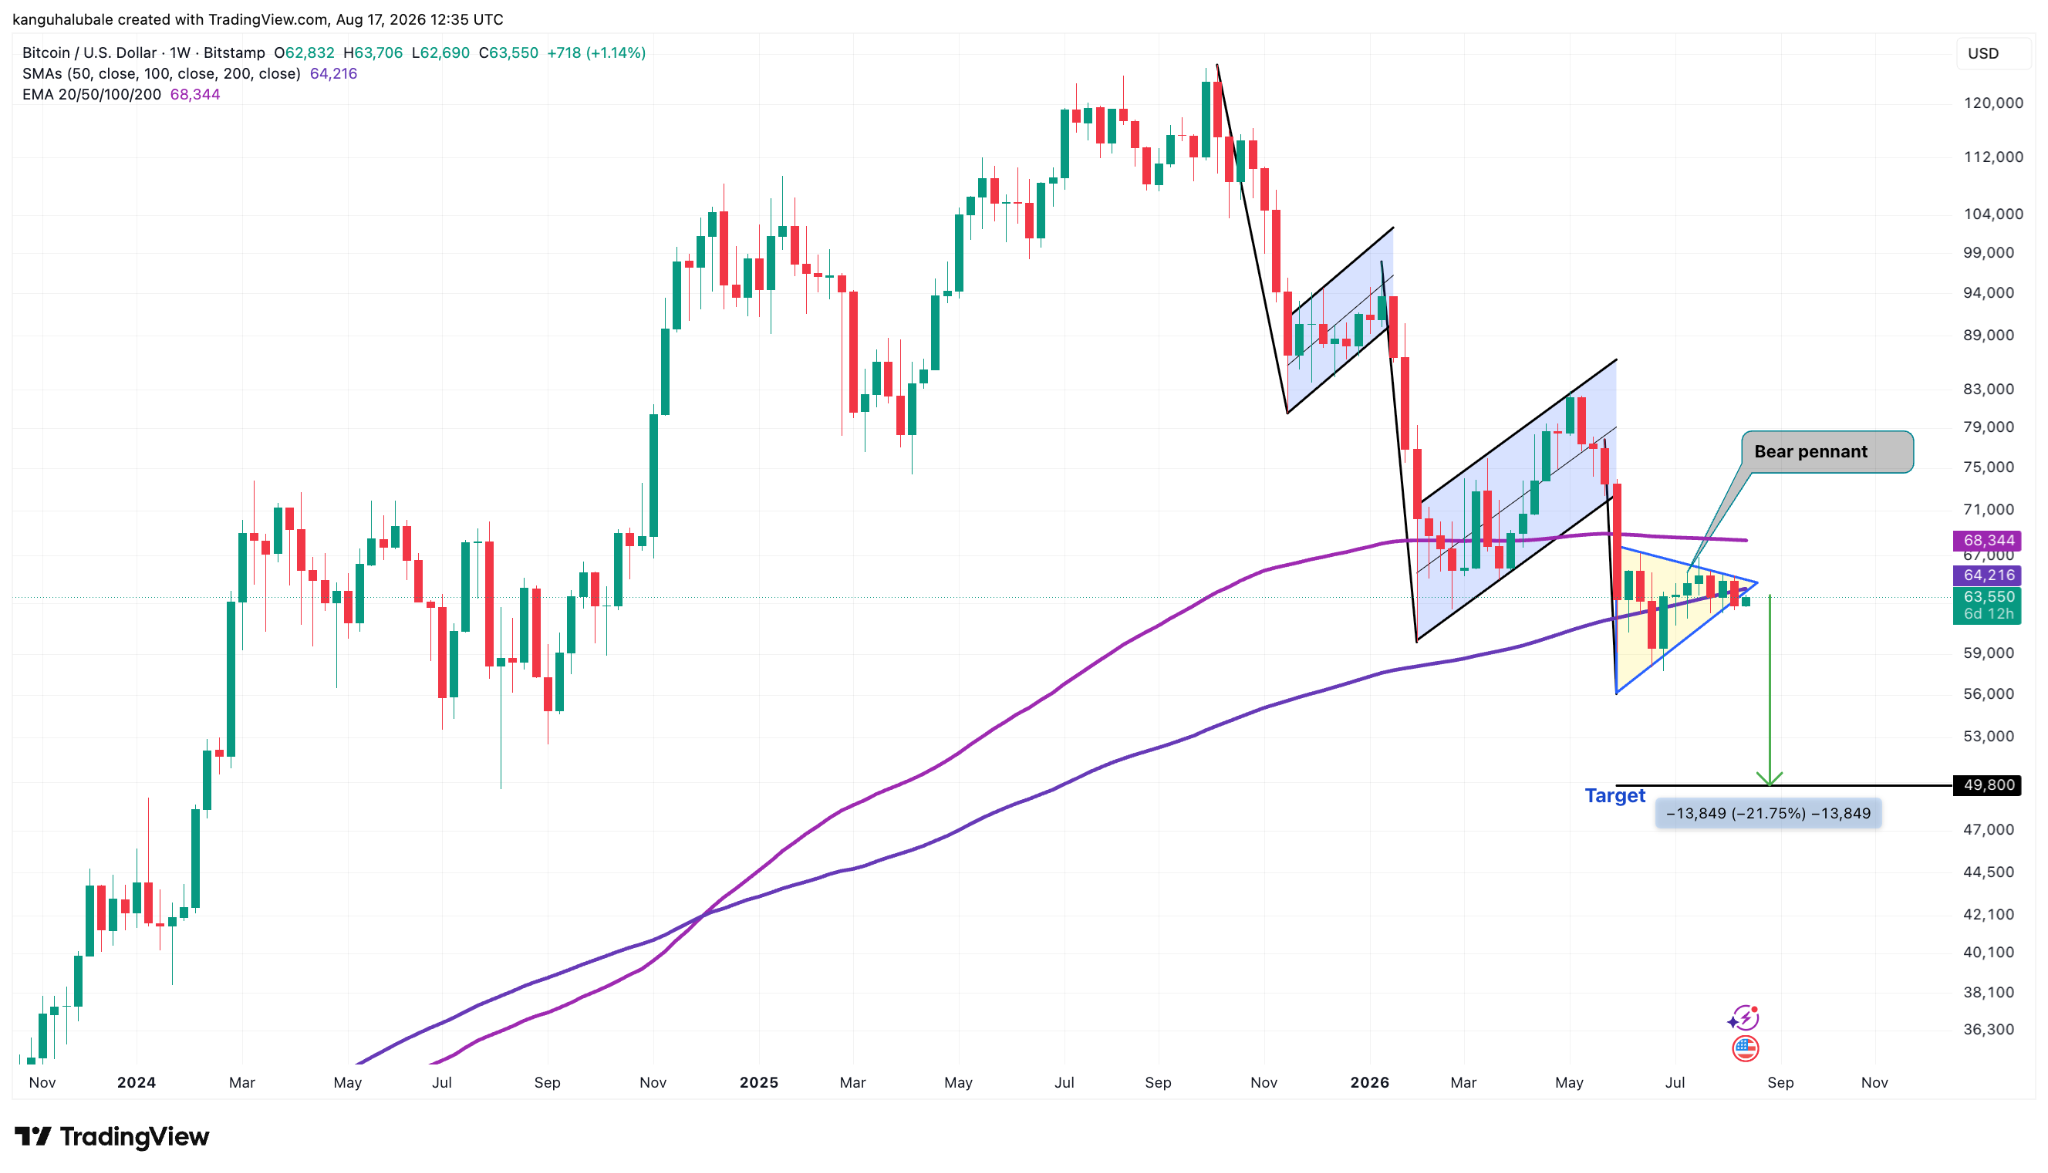
Bitcoin has broken below a bear pennant, marking the third bearish pennant-style breakdown highlighted by traders this year.
BTC/USD’s break below the first bear flag in January resulted in a 33% drop to $59,930 from $98,000 within three weeks. The second bear flag breakdown happened in early June when Bitcoin slid below the lower boundary of the flag at $72,000, resulting in a 32.5% drop to $59,000.
In the current setup, BTC dropped below the support line of a bear pennant at $64,000 last week, suggesting that the bears were back in control.
The measured target of the pennant is $49,900, about 22% below the current price.
BTC/USD weekly chart. Source: TradingView
The BTC/USD pair has been making a sequence of weaker rebounds rather than establishing a clear higher-high sequence, leaving rallies vulnerable to renewed selling. The most important near-term test is therefore whether buyers can reclaim broken support and hold it on a closing basis. If they cannot, the market may continue to treat previous support as resistance.
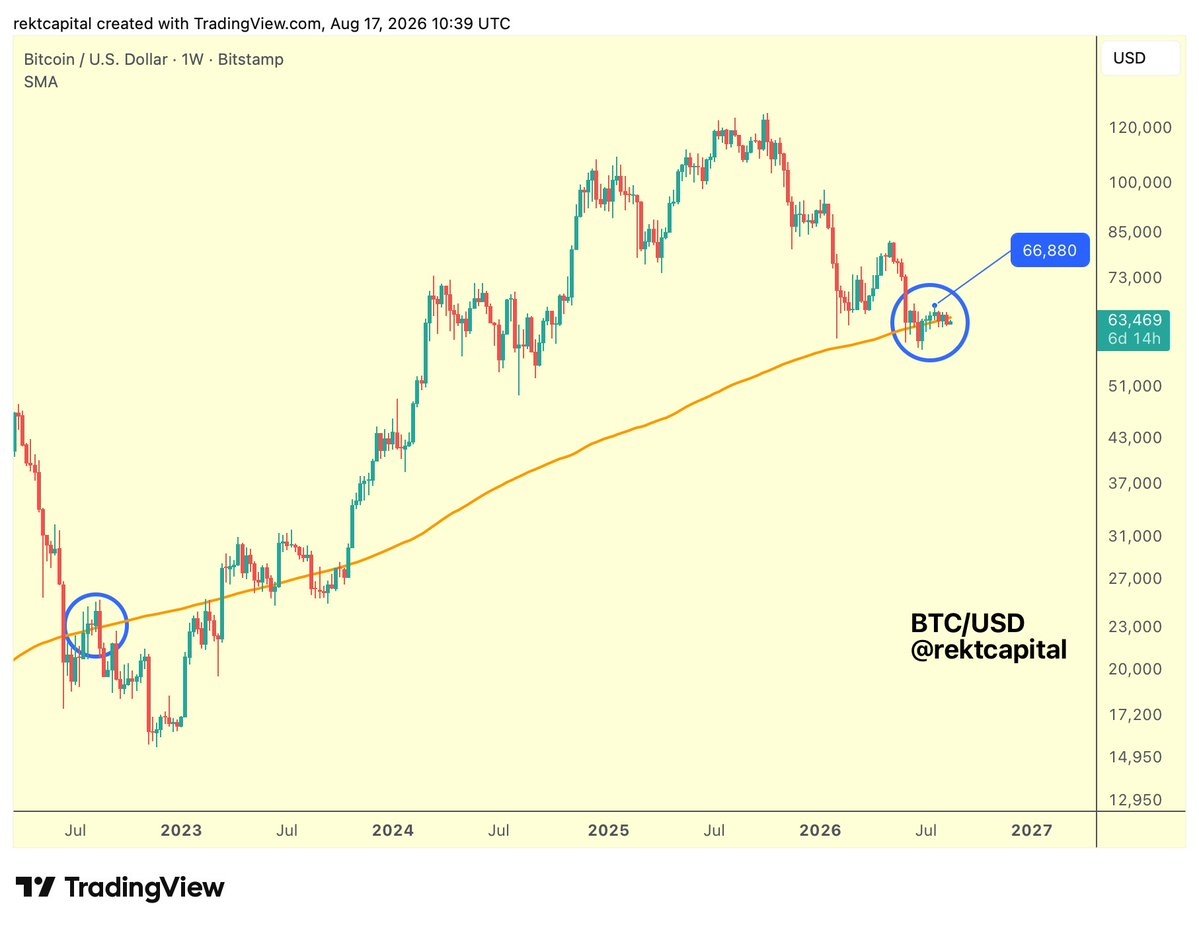
Note that $64,000 coincides with the 200-week simple moving average (SMA), a long-term trend measure closely followed by Bitcoin traders.
A sustained failure to reclaim that average would leave it acting as overhead resistance, strengthening the bearish outlook.
Analyst Rekt Capital observed that Bitcoin closed the week on Sunday, Aug. 16, below this trendline, saying that “turning the 200-week SMA into new resistance would be the confirmation to set up additional downside to perform a deeper downside deviation below the SMA in search of the final bear market bottoming out formation.”
BTC/USD weekly chart. Source: Rekt Capital/X
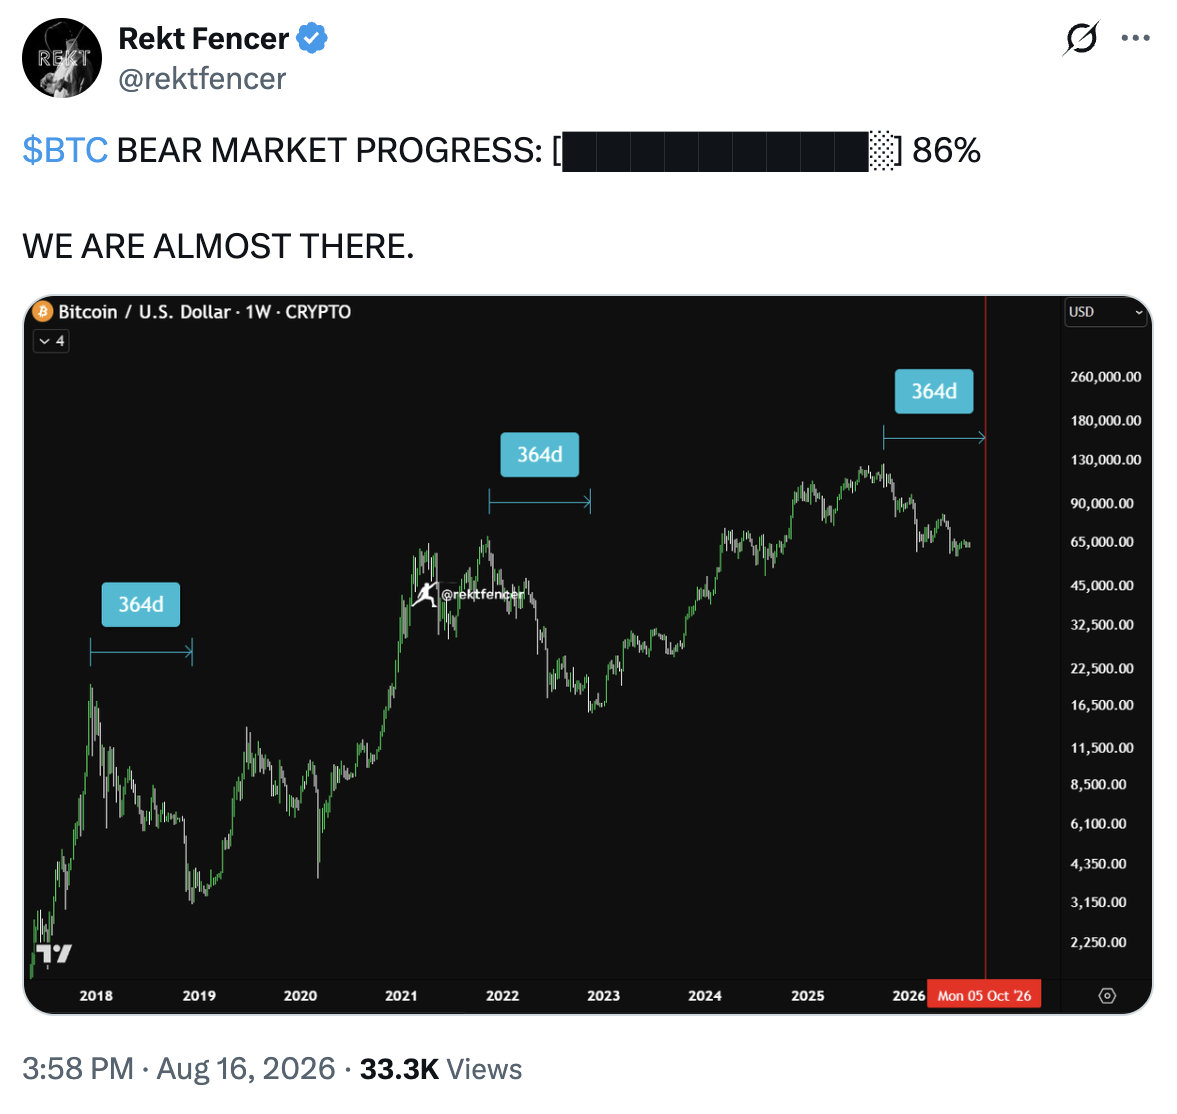
Fellow analyst Rekt Fencer said that the Bitcoin bear market progress is 86% complete, while Teddy Cleps explained that the weekly death cross involving the 21-week EMA falling below the 200-week EMA, marks the start of another correction that could last up to 8 months before BTC embarks on the next bull run.
Bitcoin bear market progress. Source: Rekt Fencer/X
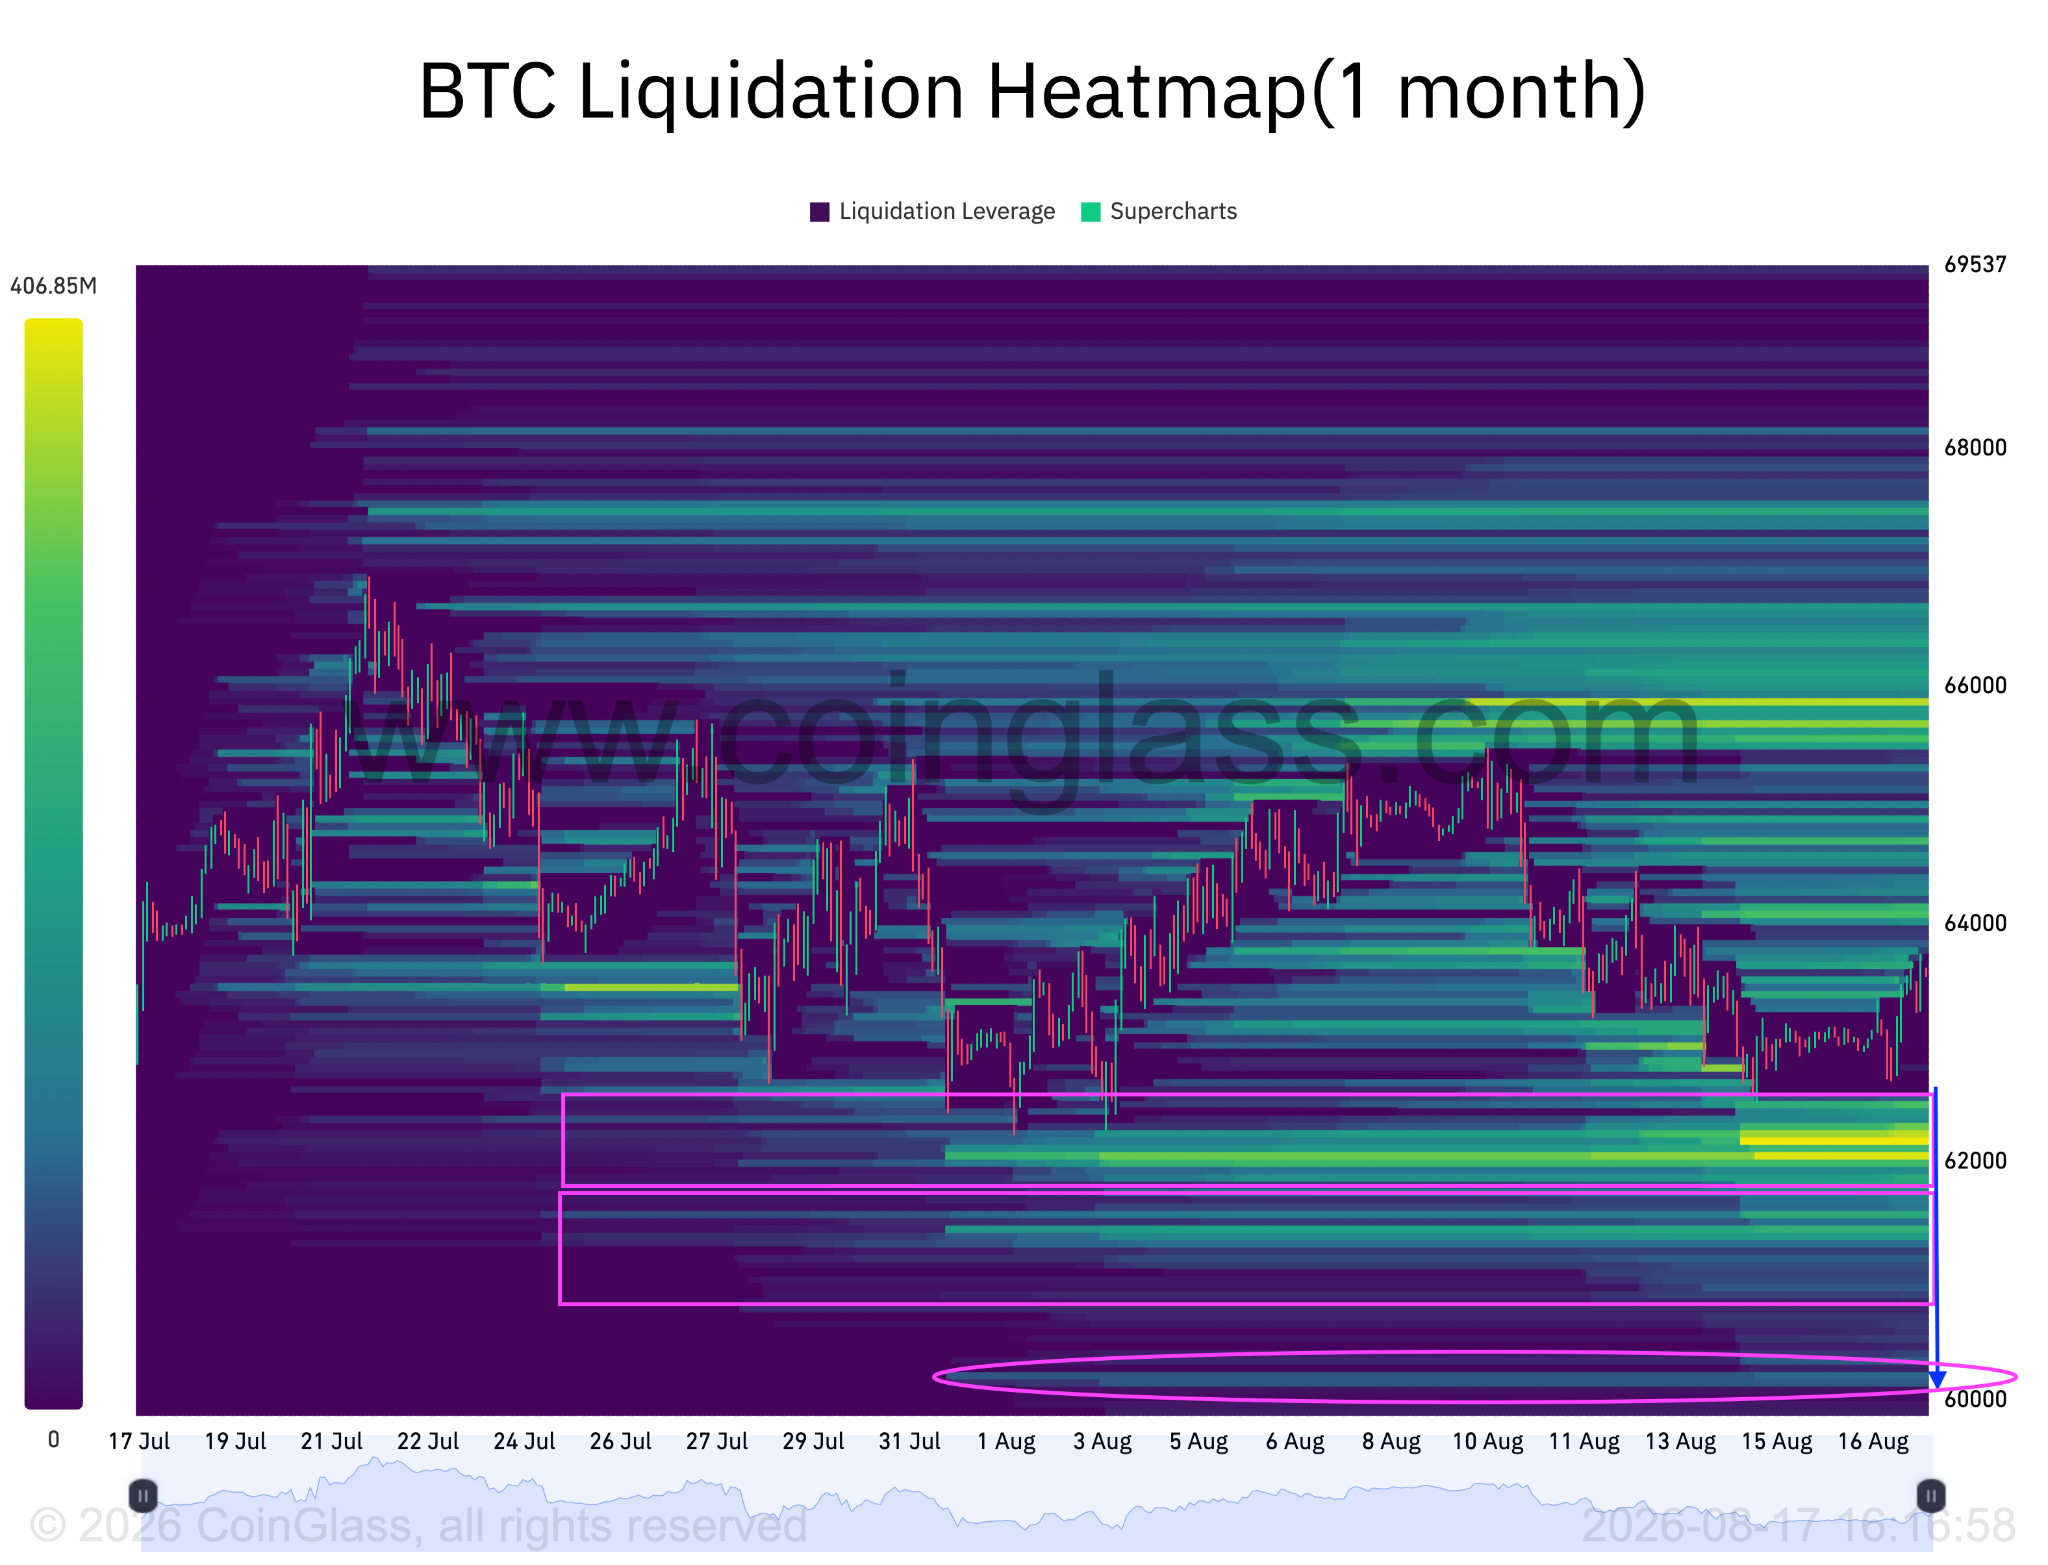
Several traders eye a potential downside liquidity grab with heavy bid orders sitting above $60,000.
The latest data from monitoring resource CoinGlass showed price eating away liquidity around $63,000, with the bulk of interest clustered below the spot price. Roughly $3 billion bid orders were sitting between $61,800 and $62,500.
Bitcoin liquidation heatmap (screenshot). Source: CoinGlass
If the $61,000 level is broken, it could spark a liquidation squeeze, forcing longs to close positions and driving prices toward $60,000, where big liquidity clusters run down to.
That does not guarantee a move to $60,000, but it makes the level increasingly relevant to the next phase of price discovery.
ETF Flows Add to Bitcoin’s Fragile Market Backdrop
The bearish technical setup is accompanied by weaker institutional demand. Spot Bitcoin ETFs recorded outflows on four of five trading days during the week ending Aug. 14, with withdrawals totaling about $390 million. The figure matters because ETF flows have become an important channel through which traditional investors gain exposure to Bitcoin.
Persistent outflows suggest reduced institutional demand available to absorb selling in the spot market. It also contrasts with periods when strong ETF inflows helped stabilize pullbacks and supported higher lows.
Recent market data has shown that ETF flows can change quickly, so the bearish signal should be treated as conditional rather than permanent. For context, U.S. spot Bitcoin ETFs experienced much larger outflow episodes earlier in 2026, including a $1.72 billion weekly withdrawal in June.
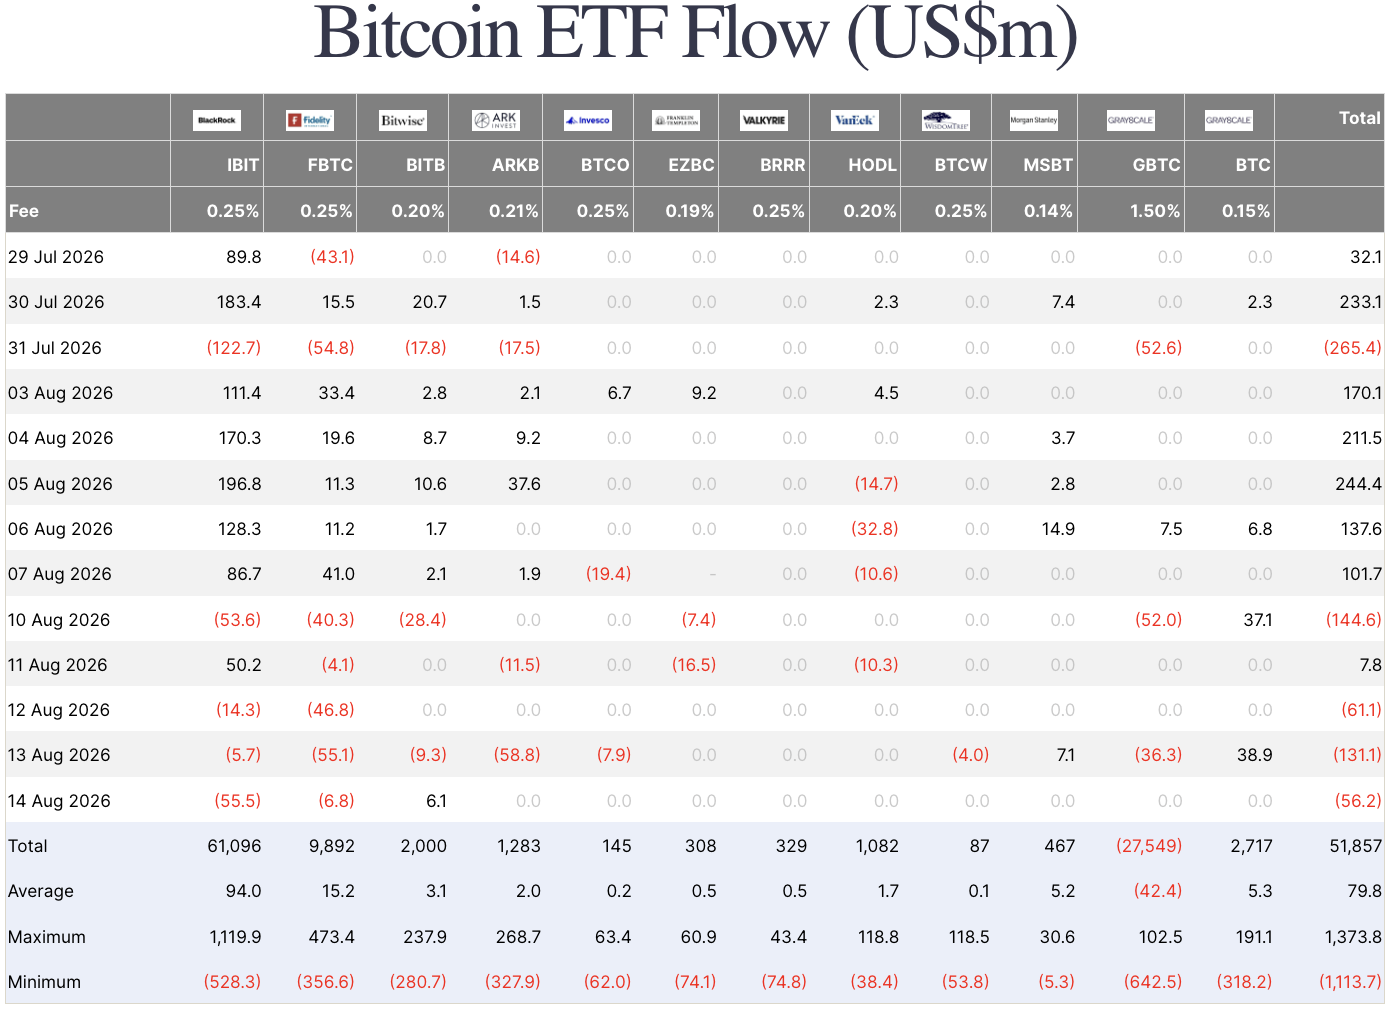
Spot Bitcoin ETFs flows table. Source: Farside Investors
The interaction between ETF flows and order-book liquidity is particularly important. If ETF redemptions continue while sell-side liquidity remains dominant below current prices, Bitcoin could find it difficult to sustain rebounds.
Conversely, a return to consistent inflows would weaken the downside thesis, pushing BTC prices higher, particularly if combined with growing adoption and long-term holder accumulation.
Ready to trade our analysis of Bitcoin? Here’s our list of the best MT4 crypto brokers worth checking out.